Programming Assignment-2#
The goal of this assingment is to allow you to practice several the following things in Python:
Perfoming typical data processing (or preprocessing if you prefer). This includes all the typical data wraning such as creating news variables, combining several datasets and more
Running explolatory data analysis including basic plotting of variables
Perfoming basic inferential statisticals using statsmodels and scipy to run hypythesis testing and build simple statistial or econometric models.
Datasets#
For this assignment, you will use the following datasets:
Rwanda Health Indicators#
The Excel file was generated by combining multiple CSV files, each containing data on different health indicators for Rwanda, So that each sheet in the file represent one such indicator. See below some of the input files which were used:
access-to-health-care_subnational_rwachild-mortality-rates_subnational_rwadhs-mobile_subnational_rwa
You can download the dataset from here.
Nights lights Data#
Please download it here and check the documentation in the cells below.
Popupation Dataset#
Please download it here and check the documentation and metadata in the class notebooks.
Submission Guidelines#
Please guidelines and complete all steps in the GitHub Workflow
Once you have completed your assignment, push chanegs to your repository.
Send a link (copy from within GitHub) to your notebook to the tutors/teaching assistants
Import Required Packages#
from pathlib import Path
import pandas as pd
import numpy as np
from matplotlib import pyplot as plt
import seaborn as sns
import statsmodels.api as sm
Setup Input Folders#
As usual, it is good practice to set up input folders using the pathlib package. In this section, make sure to define the folders where your data is stored on your machine.
I find it helpful to set up the working directory and input data folders right at the start of the notebook. To keep things organized, I use the naming convention: FILE_{NAME} for files and DIR_{NAME} for folders. We use capital letters because these are global variables that will be referenced throughout the notebook.
We’ll be using the pathlib library, which offers several advantages over traditional string-based path handling:
Cross-platform compatibility - automatically handles path separators (
/vs\) across different operating systemsObject-oriented approach - paths are objects with useful methods rather than strings
Intuitive syntax - use
/operator to join paths naturally:parent_dir / "subfolder" / "file.txt"Built-in path operations - methods like
.exists(),.is_file(),.parent,.stem, and.suffixSafer path manipulation - reduces errors from manual string concatenation and splitting
This is the recommended approach for managing file paths in modern Python development.
# Uncomment the following lines and add your code to define the directories and files
DIR_DATA = Path.cwd().parents[1].joinpath("data")
FILE_EXCEL = DIR_DATA/"rwanda/RW-Health-Data.xlsx"

# Population by enumeration area (EA) for Rwanda
FILE_CELL_POP_RW = DIR_DATA/"population-demography/rwa-cell-pop.csv"

# Nightlight data for Rwanda
FILE_CELL_NTL_RW = DIR_DATA/"ntl/cell-ntl-2015-2020-2024.csv"
Part 1: Processing Excel Files [40 Points]#
The primary goal is to preprocess an Excel file with multiple sheets into a unified CSV dataset that consolidates multiple indicators. Having all indicators in a single file at the same analytical unit (national, subnational) is more efficient than managing separate files and enables easier cross-indicator analysis.
Task 1: Generate National-Level Summaries#
For each indicator, compute a single national-level value using appropriate aggregation functions such as mean, sum or count. For this one, all available indicators can be summarized at national level, so we will have a CSV file with one row and
Expected Output Structure#
DataFrame display in Jupyter Notebook
CSV file with columns:
indicator_name: Name of the indicatoraggregated_value: Computed national valueindicator_year: Survey year or something similarsurvey_name: Name of the survey where information is coming fromaggregation_method: Statistical method used (optional)
Task 2: Subnational-Level Indicator Dataset#
Create a merged dataset for indicators with subnational data (ADM2/ADM3 levels), ensuring spatial alignment and consistent administrative boundaries.
Expected Output Structure#
indicator_name: Name of the indicatoraggregated_value: Computed national valueindicator_year: Survey year or something similarsurvey_name: Name of the survey where information is coming fromaggregation_method: Statistical method used (optional)
This structure enables both single-indicator and multi-indicator analysis at the subnational level.
Task-1: National Level Indicators#
The process to generate national summaries is fairly straigtfoward because all we need is to generate naitonal averages for each indicator. However, for the processing, we need to make sure that for each indicator, we aggregate values from the same year. This is the process I follow:
This process extracts national-level health indicators from an Excel file containing multiple sheets, each representing a different indicator. For each sheet, it removes the first row (which does not contain data), keeps only the relevant columns, and calculates the national average for each indicator and survey year. The results from all sheets are combined into a single summary table, which is then saved as a CSV file for further analysis. This approach ensures that all national-level indicator values are consistently aggregated and organized in one place.
To make our code neat,we define a function which does the processing above and saves a CSV file.
# =====================================================
# LOAD EXCEL FILE AND CHECK SHEET NAMES
# ======================================================
# Get all sheet names
sheet_names = pd.ExcelFile(FILE_EXCEL).sheet_names

# After manually reviewing columns, we only keep these
# columns
COLS_TO_KEEP = ['CountryName', 'ISO3', 'Location', 'Indicator', 'Value',
                'SurveyYear', 'SurveyId','SurveyYearLabel']
def extract_national_indicators(excel_path):
    """
    Extract national level indicators from an Excel file with multiple sheets.

    Parameters:
    -----------
    excel_path : Path or str
        Path to the Excel file containing health indicator data

    Returns:
    --------
    pandas.DataFrame
        DataFrame containing national level indicators
    """
    # Get all sheet names
    sheet_names = pd.ExcelFile(excel_path).sheet_names

    # Initialize a list to store national level indicators
    national_indicators = []

    # Loop through each sheet
    for sheet in sheet_names:
        # Read the sheet
        df = pd.read_excel(excel_path, sheet_name=sheet)

        # Drop the first row (which typically contains metadata) and reset index
        df = df.iloc[1:].reset_index(drop=True)

        # Keep only the specified columns if they exist
        if all(col in df.columns for col in COLS_TO_KEEP):
            df = df[COLS_TO_KEEP]
        else:
            # Skip sheets that don't have the expected columns
            print(f"Skipping sheet {sheet} due to missing expected columns")
            continue

        # Convert Value column to numeric (will convert errors to NaN)
        df['Value'] = pd.to_numeric(df['Value'], errors='coerce')

        # Group by Indicator and SurveyYear to calculate national averages
        grouped = df.groupby(['Indicator', 'SurveyYear']).agg({
            'Value': 'mean',
            'SurveyId': 'first',
            'SurveyYearLabel': 'first'
        }).reset_index()

        # Add the national indicators to our list
        for _, row in grouped.iterrows():
            national_indicators.append({
                'indicator_name': row['Indicator'],
                'aggregated_value': row['Value'],
                'indicator_year': row['SurveyYear'],
                'survey_name': row['SurveyId'],
                'survey_year_label': row['SurveyYearLabel'],
                'aggregation_method': 'mean',
                'source_sheet': sheet
            })

    # Create a DataFrame from the list
    national_df = pd.DataFrame(national_indicators)

    return national_df
# ==========================================================
# CALL THE FUNCTION
# ==========================================================
# Extract the national indicators
df_rw = extract_national_indicators(FILE_EXCEL)

# Display the first few rows
print(f"Total national indicators created: {len(df_rw)}")
display(df_rw.head(10))

# Save to CSV
output_path = DIR_DATA / "rwanda/national_indicators.csv"
df_rw.to_csv(output_path, index=False)
print(f"Saved national indicators to {output_path}")
Total national indicators created: 1850
| indicator_name | aggregated_value | indicator_year | survey_name | survey_year_label | aggregation_method | source_sheet | |
|---|---|---|---|---|---|---|---|
| 0 | Accepting attitudes towards those living with ... | 48.660000 | 2005 | RW2005DHS | 2005 | mean | dhs-mobile_subnational_rwa |
| 1 | Accepting attitudes towards those living with ... | 64.260000 | 2010 | RW2010DHS | 2010 | mean | dhs-mobile_subnational_rwa |
| 2 | Accepting attitudes towards those living with ... | 62.820000 | 2015 | RW2015DHS | 2014-15 | mean | dhs-mobile_subnational_rwa |
| 3 | Accepting attitudes towards those living with ... | 47.520000 | 2005 | RW2005DHS | 2005 | mean | dhs-mobile_subnational_rwa |
| 4 | Accepting attitudes towards those living with ... | 52.840000 | 2010 | RW2010DHS | 2010 | mean | dhs-mobile_subnational_rwa |
| 5 | Accepting attitudes towards those living with ... | 49.260000 | 2015 | RW2015DHS | 2014-15 | mean | dhs-mobile_subnational_rwa |
| 6 | Antenatal care from a skilled provider | 93.688095 | 1992 | RW1992DHS | 1992 | mean | dhs-mobile_subnational_rwa |
| 7 | Antenatal care from a skilled provider | 92.398039 | 2000 | RW2000DHS | 2000 | mean | dhs-mobile_subnational_rwa |
| 8 | Antenatal care from a skilled provider | 94.313333 | 2005 | RW2005DHS | 2005 | mean | dhs-mobile_subnational_rwa |
| 9 | Antenatal care from a skilled provider | 95.913333 | 2008 | RW2008DHS | 2007-08 | mean | dhs-mobile_subnational_rwa |
Saved national indicators to /Users/dmatekenya/My Drive (dmatekenya@gmail.com)/TEACHING/AIMS-DSCBI/data/rwanda/national_indicators.csv
📝 Marking Notes for Part-1-Task-1
- Total Points: 15
- You can decide how to assign points
- Someone gets full points if they have code and they have displayed the dataframe above in their notebook
Task-2: Subnational Indicators#
To create a comprehensive subnational indicator dataset, we first need to understand which indicators are available at the district (ADM2) level. Rwanda has 30 districts, so we’ll focus on sheets that contain data with approximately this number of unique locations.
Our approach involves:
Examining the data structure to identify which indicators are available at district level
Extracting these indicators while preserving their spatial and temporal context
Standardizing the district names to ensure consistent spatial referencing
Creating a unified dataset that allows for both single-indicator and cross-indicator analysis
This process is more complex than the national-level aggregation because we need to maintain the spatial dimension and ensure proper alignment across indicators collected in different years or from different surveys. The function below implements this extraction logic, filtering for sheets that contain district-level data.
For manual inspection of variables, I used something like this:
df = pd.read_excel(FILE_EXCEL, sheet_name=sheet_names[0])

# Pick indicator to work with
df_indicator = df.query('Indicator == "Women who want no more children"')
yrs = df_indicator.SurveyYear.unique()

# Unique Locations for each survey year
locations = {yr: len(df_indicator.query('SurveyYear == @yr').Location.unique()) for yr in yrs}
def extract_adm2_indicators(excel_path):
    """
    Extract indicators available at ADM2 (district) level from an Excel file with multiple sheets.
    This function checks for district-level granularity at the indicator and year level,
    rather than just at the sheet level.

    Parameters:
    -----------
    excel_path : Path or str
        Path to the Excel file containing health indicator data

    Returns:
    --------
    pandas.DataFrame
        DataFrame containing ADM2-level indicators
    """
    # Get all sheet names
    sheet_names = pd.ExcelFile(excel_path).sheet_names

    # Initialize a list to store ADM2 indicators
    adm2_indicators = []

    # Loop through each sheet
    for sheet in sheet_names:
        try:
            # Read the sheet
            df = pd.read_excel(excel_path, sheet_name=sheet)

            # Drop the first row (which typically contains metadata) and reset index
            df = df.iloc[1:].reset_index(drop=True)

            # Keep only the specified columns if they exist
            if all(col in df.columns for col in COLS_TO_KEEP):
                df = df[COLS_TO_KEEP]
            else:
                print(f"Skipping sheet {sheet} due to missing expected columns")
                continue

            # Convert Value column to numeric
            df['Value'] = pd.to_numeric(df['Value'], errors='coerce')

            # Process by indicator and year combination to check for district-level data
            for (indicator, year), group in df.groupby(['Indicator', 'SurveyYear']):
                unique_locs = group['Location'].dropna().unique()

                # Check if this indicator-year combination has district-level data
                # Rwanda has 30 districts, but we'll accept 6-35 to account for potential changes
                # or different naming conventions
                if 6 <= len(unique_locs) <= 35:
                    # Group by Location to get district-level means
                    for _, row in group.groupby('Location').agg({
                        'Value': 'mean',
                        'SurveyId': 'first',
                        'SurveyYearLabel': 'first'
                    }).reset_index().iterrows():
                        adm2_indicators.append({
                            'indicator_name': indicator,
                            'district': row['Location'],
                            'aggregated_value': row['Value'],
                            'indicator_year': year,
                            'survey_name': row['SurveyId'],
                            'survey_year_label': row['SurveyYearLabel'],
                            'aggregation_method': 'mean',
                            'source_sheet': sheet
                        })
                else:
                    print(f"Skipping indicator '{indicator}' for year {year} - not at district level (found {len(unique_locs)} unique locations)")

        except Exception as e:
            print(f"Error processing sheet {sheet}: {e}")

    # Create a DataFrame from the list
    adm2_df = pd.DataFrame(adm2_indicators)

    # Add district count per indicator-year combination for validation
    if not adm2_df.empty:
        district_counts = adm2_df.groupby(['indicator_name', 'indicator_year']).size().reset_index(name='district_count')
        print(f"Created dataset with {len(adm2_df)} rows across {len(district_counts)} indicator-year combinations")
    else:
        print("No district-level indicators found")

    return adm2_df
df_adm2 = extract_adm2_indicators(excel_path=FILE_EXCEL)
Skipping indicator 'Accepting attitudes towards those living with HIV - Composite of 4 components [Men]' for year 2005 - not at district level (found 5 unique locations)
Skipping indicator 'Accepting attitudes towards those living with HIV - Composite of 4 components [Men]' for year 2010 - not at district level (found 5 unique locations)
Skipping indicator 'Accepting attitudes towards those living with HIV - Composite of 4 components [Men]' for year 2015 - not at district level (found 5 unique locations)
Skipping indicator 'Accepting attitudes towards those living with HIV - Composite of 4 components [Women]' for year 2005 - not at district level (found 5 unique locations)
Skipping indicator 'Accepting attitudes towards those living with HIV - Composite of 4 components [Women]' for year 2010 - not at district level (found 5 unique locations)
Skipping indicator 'Accepting attitudes towards those living with HIV - Composite of 4 components [Women]' for year 2015 - not at district level (found 5 unique locations)
Skipping indicator 'Antenatal care from a skilled provider' for year 2005 - not at district level (found 5 unique locations)
Skipping indicator 'Antenatal care from a skilled provider' for year 2008 - not at district level (found 5 unique locations)
Skipping indicator 'Antenatal care from a skilled provider' for year 2010 - not at district level (found 5 unique locations)
Skipping indicator 'Antenatal care from a skilled provider' for year 2013 - not at district level (found 5 unique locations)
Skipping indicator 'Antenatal care from a skilled provider' for year 2015 - not at district level (found 5 unique locations)
Skipping indicator 'Antenatal care from a skilled provider' for year 2017 - not at district level (found 5 unique locations)
Skipping indicator 'Antenatal care from a skilled provider' for year 2019 - not at district level (found 5 unique locations)
Skipping indicator 'Antenatal visits for pregnancy: 4+ visits' for year 2005 - not at district level (found 5 unique locations)
Skipping indicator 'Antenatal visits for pregnancy: 4+ visits' for year 2008 - not at district level (found 5 unique locations)
Skipping indicator 'Antenatal visits for pregnancy: 4+ visits' for year 2010 - not at district level (found 5 unique locations)
Skipping indicator 'Antenatal visits for pregnancy: 4+ visits' for year 2015 - not at district level (found 5 unique locations)
Skipping indicator 'Antenatal visits for pregnancy: 4+ visits' for year 2019 - not at district level (found 5 unique locations)
Skipping indicator 'Assistance during delivery from a skilled provider' for year 2005 - not at district level (found 5 unique locations)
Skipping indicator 'Assistance during delivery from a skilled provider' for year 2008 - not at district level (found 5 unique locations)
Skipping indicator 'Assistance during delivery from a skilled provider' for year 2010 - not at district level (found 5 unique locations)
Skipping indicator 'Assistance during delivery from a skilled provider' for year 2015 - not at district level (found 5 unique locations)
Skipping indicator 'Assistance during delivery from a skilled provider' for year 2019 - not at district level (found 5 unique locations)
Skipping indicator 'BCG vaccination received' for year 2005 - not at district level (found 5 unique locations)
Skipping indicator 'BCG vaccination received' for year 2008 - not at district level (found 5 unique locations)
Skipping indicator 'BCG vaccination received' for year 2010 - not at district level (found 5 unique locations)
Skipping indicator 'BCG vaccination received' for year 2015 - not at district level (found 5 unique locations)
Skipping indicator 'BCG vaccination received' for year 2019 - not at district level (found 5 unique locations)
Skipping indicator 'Breastfed children 6-23 months fed both 4+ food groups and the minimum meal frequency' for year 2010 - not at district level (found 5 unique locations)
Skipping indicator 'Breastfed children 6-23 months fed both 4+ food groups and the minimum meal frequency' for year 2015 - not at district level (found 5 unique locations)
Skipping indicator 'Breastfed children 6-23 months fed both 4+ food groups and the minimum meal frequency' for year 2019 - not at district level (found 5 unique locations)
Skipping indicator 'Child mortality rate' for year 2005 - not at district level (found 5 unique locations)
Skipping indicator 'Child mortality rate' for year 2008 - not at district level (found 5 unique locations)
Skipping indicator 'Child mortality rate' for year 2010 - not at district level (found 5 unique locations)
Skipping indicator 'Child mortality rate' for year 2015 - not at district level (found 5 unique locations)
Skipping indicator 'Child mortality rate' for year 2019 - not at district level (found 5 unique locations)
Skipping indicator 'Children 6-23 months that consumed foods rich in iron in the last 24 hours' for year 2010 - not at district level (found 5 unique locations)
Skipping indicator 'Children 6-23 months that consumed foods rich in iron in the last 24 hours' for year 2015 - not at district level (found 5 unique locations)
Skipping indicator 'Children 6-23 months that consumed foods rich in iron in the last 24 hours' for year 2019 - not at district level (found 5 unique locations)
Skipping indicator 'Children 6-23 months that consumed foods rich in vitamin A in the last 24 hours' for year 2010 - not at district level (found 5 unique locations)
Skipping indicator 'Children 6-23 months that consumed foods rich in vitamin A in the last 24 hours' for year 2015 - not at district level (found 5 unique locations)
Skipping indicator 'Children 6-23 months that consumed foods rich in vitamin A in the last 24 hours' for year 2019 - not at district level (found 5 unique locations)
Skipping indicator 'Children 6-23 months with 3 IYCF practices' for year 2010 - not at district level (found 5 unique locations)
Skipping indicator 'Children 6-23 months with 3 IYCF practices' for year 2015 - not at district level (found 5 unique locations)
Skipping indicator 'Children 6-23 months with 3 IYCF practices' for year 2019 - not at district level (found 5 unique locations)
Skipping indicator 'Children consuming vitamin A supplements' for year 2008 - not at district level (found 5 unique locations)
Skipping indicator 'Children consuming vitamin A supplements' for year 2010 - not at district level (found 5 unique locations)
Skipping indicator 'Children consuming vitamin A supplements' for year 2015 - not at district level (found 5 unique locations)
Skipping indicator 'Children consuming vitamin A supplements' for year 2019 - not at district level (found 5 unique locations)
Skipping indicator 'Children registered' for year 2005 - not at district level (found 5 unique locations)
Skipping indicator 'Children registered' for year 2010 - not at district level (found 5 unique locations)
Skipping indicator 'Children registered' for year 2015 - not at district level (found 5 unique locations)
Skipping indicator 'Children registered' for year 2019 - not at district level (found 5 unique locations)
Skipping indicator 'Children stunted' for year 2005 - not at district level (found 5 unique locations)
Skipping indicator 'Children stunted' for year 2010 - not at district level (found 5 unique locations)
Skipping indicator 'Children stunted' for year 2015 - not at district level (found 5 unique locations)
Skipping indicator 'Children stunted' for year 2019 - not at district level (found 5 unique locations)
Skipping indicator 'Children under 5 who slept under an insecticide-treated net (ITN)' for year 2005 - not at district level (found 5 unique locations)
Skipping indicator 'Children under 5 who slept under an insecticide-treated net (ITN)' for year 2008 - not at district level (found 5 unique locations)
Skipping indicator 'Children under 5 who slept under an insecticide-treated net (ITN)' for year 2010 - not at district level (found 5 unique locations)
Skipping indicator 'Children under 5 who slept under an insecticide-treated net (ITN)' for year 2013 - not at district level (found 5 unique locations)
Skipping indicator 'Children under 5 who slept under an insecticide-treated net (ITN)' for year 2015 - not at district level (found 5 unique locations)
Skipping indicator 'Children under 5 who slept under an insecticide-treated net (ITN)' for year 2017 - not at district level (found 5 unique locations)
Skipping indicator 'Children under 5 who slept under an insecticide-treated net (ITN)' for year 2019 - not at district level (found 5 unique locations)
Skipping indicator 'Children underweight' for year 2005 - not at district level (found 5 unique locations)
Skipping indicator 'Children underweight' for year 2010 - not at district level (found 5 unique locations)
Skipping indicator 'Children underweight' for year 2015 - not at district level (found 5 unique locations)
Skipping indicator 'Children underweight' for year 2019 - not at district level (found 5 unique locations)
Skipping indicator 'Children wasted' for year 2005 - not at district level (found 5 unique locations)
Skipping indicator 'Children wasted' for year 2010 - not at district level (found 5 unique locations)
Skipping indicator 'Children wasted' for year 2015 - not at district level (found 5 unique locations)
Skipping indicator 'Children wasted' for year 2019 - not at district level (found 5 unique locations)
Skipping indicator 'Children who took any ACT' for year 2010 - not at district level (found 3 unique locations)
Skipping indicator 'Children who took any ACT' for year 2013 - not at district level (found 2 unique locations)
Skipping indicator 'Children who took any ACT' for year 2015 - not at district level (found 2 unique locations)
Skipping indicator 'Children who took any ACT' for year 2017 - not at district level (found 2 unique locations)
Skipping indicator 'Children who took any ACT' for year 2019 - not at district level (found 2 unique locations)
Skipping indicator 'Children with ARI for whom advice or treatment was sought' for year 2005 - not at district level (found 5 unique locations)
Skipping indicator 'Children with ARI for whom advice or treatment was sought' for year 2008 - not at district level (found 5 unique locations)
Skipping indicator 'Children with ARI for whom advice or treatment was sought' for year 2010 - not at district level (found 5 unique locations)
Skipping indicator 'Children with ARI for whom advice or treatment was sought' for year 2015 - not at district level (found 5 unique locations)
Skipping indicator 'Children with ARI for whom advice or treatment was sought' for year 2019 - not at district level (found 2 unique locations)
Skipping indicator 'Children with any anemia' for year 2005 - not at district level (found 5 unique locations)
Skipping indicator 'Children with any anemia' for year 2008 - not at district level (found 5 unique locations)
Skipping indicator 'Children with any anemia' for year 2010 - not at district level (found 5 unique locations)
Skipping indicator 'Children with any anemia' for year 2015 - not at district level (found 5 unique locations)
Skipping indicator 'Children with any anemia' for year 2019 - not at district level (found 5 unique locations)
Skipping indicator 'Children with diarrhea' for year 2005 - not at district level (found 5 unique locations)
Skipping indicator 'Children with diarrhea' for year 2008 - not at district level (found 5 unique locations)
Skipping indicator 'Children with diarrhea' for year 2010 - not at district level (found 5 unique locations)
Skipping indicator 'Children with diarrhea' for year 2015 - not at district level (found 5 unique locations)
Skipping indicator 'Children with diarrhea' for year 2019 - not at district level (found 5 unique locations)
Skipping indicator 'Children with fever for whom advice or treatment was sought' for year 2005 - not at district level (found 5 unique locations)
Skipping indicator 'Children with fever for whom advice or treatment was sought' for year 2008 - not at district level (found 5 unique locations)
Skipping indicator 'Children with fever for whom advice or treatment was sought' for year 2010 - not at district level (found 5 unique locations)
Skipping indicator 'Children with fever for whom advice or treatment was sought' for year 2013 - not at district level (found 5 unique locations)
Skipping indicator 'Children with fever for whom advice or treatment was sought' for year 2015 - not at district level (found 5 unique locations)
Skipping indicator 'Children with fever for whom advice or treatment was sought' for year 2017 - not at district level (found 5 unique locations)
Skipping indicator 'Children with fever for whom advice or treatment was sought' for year 2019 - not at district level (found 5 unique locations)
Skipping indicator 'Children with fever in the last two weeks' for year 2005 - not at district level (found 5 unique locations)
Skipping indicator 'Children with fever in the last two weeks' for year 2008 - not at district level (found 5 unique locations)
Skipping indicator 'Children with fever in the last two weeks' for year 2010 - not at district level (found 5 unique locations)
Skipping indicator 'Children with fever in the last two weeks' for year 2013 - not at district level (found 5 unique locations)
Skipping indicator 'Children with fever in the last two weeks' for year 2015 - not at district level (found 5 unique locations)
Skipping indicator 'Children with fever in the last two weeks' for year 2017 - not at district level (found 5 unique locations)
Skipping indicator 'Children with fever in the last two weeks' for year 2019 - not at district level (found 5 unique locations)
Skipping indicator 'Children with fever who had blood taken from a finger or heel for testing' for year 2010 - not at district level (found 5 unique locations)
Skipping indicator 'Children with fever who had blood taken from a finger or heel for testing' for year 2013 - not at district level (found 5 unique locations)
Skipping indicator 'Children with fever who had blood taken from a finger or heel for testing' for year 2015 - not at district level (found 5 unique locations)
Skipping indicator 'Children with fever who had blood taken from a finger or heel for testing' for year 2017 - not at district level (found 5 unique locations)
Skipping indicator 'Children with fever who had blood taken from a finger or heel for testing' for year 2019 - not at district level (found 5 unique locations)
Skipping indicator 'Children with hemoglobin lower than 8.0 g/dl' for year 2005 - not at district level (found 5 unique locations)
Skipping indicator 'Children with hemoglobin lower than 8.0 g/dl' for year 2008 - not at district level (found 5 unique locations)
Skipping indicator 'Children with hemoglobin lower than 8.0 g/dl' for year 2010 - not at district level (found 5 unique locations)
Skipping indicator 'Children with hemoglobin lower than 8.0 g/dl' for year 2015 - not at district level (found 5 unique locations)
Skipping indicator 'Children with hemoglobin lower than 8.0 g/dl' for year 2019 - not at district level (found 5 unique locations)
Skipping indicator 'Children with symptoms of ARI' for year 2005 - not at district level (found 5 unique locations)
Skipping indicator 'Children with symptoms of ARI' for year 2008 - not at district level (found 5 unique locations)
Skipping indicator 'Children with symptoms of ARI' for year 2010 - not at district level (found 5 unique locations)
Skipping indicator 'Children with symptoms of ARI' for year 2015 - not at district level (found 5 unique locations)
Skipping indicator 'Children with symptoms of ARI' for year 2019 - not at district level (found 5 unique locations)
Skipping indicator 'Comprehensive correct knowledge about AIDS [Men]' for year 2005 - not at district level (found 5 unique locations)
Skipping indicator 'Comprehensive correct knowledge about AIDS [Men]' for year 2010 - not at district level (found 5 unique locations)
Skipping indicator 'Comprehensive correct knowledge about AIDS [Men]' for year 2015 - not at district level (found 5 unique locations)
Skipping indicator 'Comprehensive correct knowledge about AIDS [Men]' for year 2019 - not at district level (found 5 unique locations)
Skipping indicator 'Comprehensive correct knowledge about AIDS [Women]' for year 2005 - not at district level (found 5 unique locations)
Skipping indicator 'Comprehensive correct knowledge about AIDS [Women]' for year 2010 - not at district level (found 5 unique locations)
Skipping indicator 'Comprehensive correct knowledge about AIDS [Women]' for year 2015 - not at district level (found 5 unique locations)
Skipping indicator 'Comprehensive correct knowledge about AIDS [Women]' for year 2019 - not at district level (found 5 unique locations)
Skipping indicator 'Condom use during higher-risk sex (with multiple partners) [Men]' for year 2005 - not at district level (found 2 unique locations)
Skipping indicator 'Condom use during higher-risk sex (with multiple partners) [Men]' for year 2010 - not at district level (found 4 unique locations)
Skipping indicator 'Condom use during higher-risk sex (with multiple partners) [Men]' for year 2015 - not at district level (found 5 unique locations)
Skipping indicator 'Condom use during higher-risk sex (with multiple partners) [Men]' for year 2019 - not at district level (found 5 unique locations)
Skipping indicator 'Condom use during higher-risk sex (with multiple partners) [Women]' for year 2015 - not at district level (found 2 unique locations)
Skipping indicator 'Condom use during higher-risk sex (with multiple partners) [Women]' for year 2019 - not at district level (found 4 unique locations)
Skipping indicator 'DPT 3 vaccination received' for year 2005 - not at district level (found 5 unique locations)
Skipping indicator 'DPT 3 vaccination received' for year 2008 - not at district level (found 5 unique locations)
Skipping indicator 'DPT 3 vaccination received' for year 2010 - not at district level (found 5 unique locations)
Skipping indicator 'DPT 3 vaccination received' for year 2015 - not at district level (found 5 unique locations)
Skipping indicator 'DPT 3 vaccination received' for year 2019 - not at district level (found 5 unique locations)
Skipping indicator 'Delivery by cesarean section' for year 2005 - not at district level (found 5 unique locations)
Skipping indicator 'Delivery by cesarean section' for year 2010 - not at district level (found 5 unique locations)
Skipping indicator 'Delivery by cesarean section' for year 2015 - not at district level (found 5 unique locations)
Skipping indicator 'Delivery by cesarean section' for year 2019 - not at district level (found 5 unique locations)
Skipping indicator 'Demand for family planning satisfied' for year 2005 - not at district level (found 5 unique locations)
Skipping indicator 'Demand for family planning satisfied' for year 2008 - not at district level (found 5 unique locations)
Skipping indicator 'Demand for family planning satisfied' for year 2010 - not at district level (found 5 unique locations)
Skipping indicator 'Demand for family planning satisfied' for year 2015 - not at district level (found 5 unique locations)
Skipping indicator 'Demand for family planning satisfied' for year 2019 - not at district level (found 5 unique locations)
Skipping indicator 'Demand for family planning satisfied by modern methods' for year 2005 - not at district level (found 5 unique locations)
Skipping indicator 'Demand for family planning satisfied by modern methods' for year 2008 - not at district level (found 5 unique locations)
Skipping indicator 'Demand for family planning satisfied by modern methods' for year 2010 - not at district level (found 5 unique locations)
Skipping indicator 'Demand for family planning satisfied by modern methods' for year 2015 - not at district level (found 5 unique locations)
Skipping indicator 'Demand for family planning satisfied by modern methods' for year 2019 - not at district level (found 5 unique locations)
Skipping indicator 'Ever experienced physical violence since age 15' for year 2005 - not at district level (found 5 unique locations)
Skipping indicator 'Ever experienced physical violence since age 15' for year 2010 - not at district level (found 5 unique locations)
Skipping indicator 'Ever experienced physical violence since age 15' for year 2015 - not at district level (found 5 unique locations)
Skipping indicator 'Ever experienced physical violence since age 15' for year 2019 - not at district level (found 5 unique locations)
Skipping indicator 'Feeding practices during diarrhea: Continued feeding, and ORT and/or increased fluids' for year 2005 - not at district level (found 5 unique locations)
Skipping indicator 'Feeding practices during diarrhea: Continued feeding, and ORT and/or increased fluids' for year 2008 - not at district level (found 5 unique locations)
Skipping indicator 'Feeding practices during diarrhea: Continued feeding, and ORT and/or increased fluids' for year 2010 - not at district level (found 5 unique locations)
Skipping indicator 'Feeding practices during diarrhea: Continued feeding, and ORT and/or increased fluids' for year 2015 - not at district level (found 5 unique locations)
Skipping indicator 'Feeding practices during diarrhea: Continued feeding, and ORT and/or increased fluids' for year 2019 - not at district level (found 5 unique locations)
Skipping indicator 'Feeding practices during diarrhea: ORT and continued feeding' for year 2005 - not at district level (found 5 unique locations)
Skipping indicator 'Feeding practices during diarrhea: ORT and continued feeding' for year 2008 - not at district level (found 5 unique locations)
Skipping indicator 'Feeding practices during diarrhea: ORT and continued feeding' for year 2010 - not at district level (found 5 unique locations)
Skipping indicator 'Feeding practices during diarrhea: ORT and continued feeding' for year 2015 - not at district level (found 5 unique locations)
Skipping indicator 'Feeding practices during diarrhea: ORT and continued feeding' for year 2019 - not at district level (found 5 unique locations)
Skipping indicator 'Fully vaccinated (8 basic antigens)' for year 2005 - not at district level (found 5 unique locations)
Skipping indicator 'Fully vaccinated (8 basic antigens)' for year 2008 - not at district level (found 5 unique locations)
Skipping indicator 'Fully vaccinated (8 basic antigens)' for year 2010 - not at district level (found 5 unique locations)
Skipping indicator 'Fully vaccinated (8 basic antigens)' for year 2015 - not at district level (found 5 unique locations)
Skipping indicator 'Fully vaccinated (8 basic antigens)' for year 2019 - not at district level (found 5 unique locations)
Skipping indicator 'Gender parity index for net primary school attendance' for year 2005 - not at district level (found 5 unique locations)
Skipping indicator 'Gender parity index for net primary school attendance' for year 2015 - not at district level (found 5 unique locations)
Skipping indicator 'Gender parity index for net primary school attendance' for year 2019 - not at district level (found 5 unique locations)
Skipping indicator 'Gender parity index for net secondary school attendance' for year 2005 - not at district level (found 5 unique locations)
Skipping indicator 'Gender parity index for net secondary school attendance' for year 2015 - not at district level (found 5 unique locations)
Skipping indicator 'Gender parity index for net secondary school attendance' for year 2019 - not at district level (found 5 unique locations)
Skipping indicator 'General fertility rate' for year 2005 - not at district level (found 5 unique locations)
Skipping indicator 'General fertility rate' for year 2008 - not at district level (found 5 unique locations)
Skipping indicator 'General fertility rate' for year 2010 - not at district level (found 5 unique locations)
Skipping indicator 'General fertility rate' for year 2013 - not at district level (found 5 unique locations)
Skipping indicator 'General fertility rate' for year 2015 - not at district level (found 5 unique locations)
Skipping indicator 'General fertility rate' for year 2017 - not at district level (found 5 unique locations)
Skipping indicator 'General fertility rate' for year 2019 - not at district level (found 5 unique locations)
Skipping indicator 'HIV prevalence among general population' for year 2005 - not at district level (found 5 unique locations)
Skipping indicator 'HIV prevalence among general population' for year 2010 - not at district level (found 5 unique locations)
Skipping indicator 'HIV prevalence among general population' for year 2015 - not at district level (found 5 unique locations)
Skipping indicator 'HIV prevalence among men' for year 2005 - not at district level (found 5 unique locations)
Skipping indicator 'HIV prevalence among men' for year 2010 - not at district level (found 5 unique locations)
Skipping indicator 'HIV prevalence among men' for year 2015 - not at district level (found 5 unique locations)
Skipping indicator 'HIV prevalence among women' for year 2005 - not at district level (found 5 unique locations)
Skipping indicator 'HIV prevalence among women' for year 2010 - not at district level (found 5 unique locations)
Skipping indicator 'HIV prevalence among women' for year 2015 - not at district level (found 5 unique locations)
Skipping indicator 'Households with at least one insecticide-treated mosquito net (ITN)' for year 2005 - not at district level (found 5 unique locations)
Skipping indicator 'Households with at least one insecticide-treated mosquito net (ITN)' for year 2008 - not at district level (found 5 unique locations)
Skipping indicator 'Households with at least one insecticide-treated mosquito net (ITN)' for year 2010 - not at district level (found 5 unique locations)
Skipping indicator 'Households with at least one insecticide-treated mosquito net (ITN)' for year 2013 - not at district level (found 5 unique locations)
Skipping indicator 'Households with at least one insecticide-treated mosquito net (ITN)' for year 2015 - not at district level (found 5 unique locations)
Skipping indicator 'Households with at least one insecticide-treated mosquito net (ITN)' for year 2017 - not at district level (found 5 unique locations)
Skipping indicator 'Households with at least one insecticide-treated mosquito net (ITN)' for year 2019 - not at district level (found 5 unique locations)
Skipping indicator 'Households with at least one insecticide-treated mosquito net (ITN) for every two persons who stayed in the household the previous night' for year 2005 - not at district level (found 5 unique locations)
Skipping indicator 'Households with at least one insecticide-treated mosquito net (ITN) for every two persons who stayed in the household the previous night' for year 2008 - not at district level (found 5 unique locations)
Skipping indicator 'Households with at least one insecticide-treated mosquito net (ITN) for every two persons who stayed in the household the previous night' for year 2010 - not at district level (found 5 unique locations)
Skipping indicator 'Households with at least one insecticide-treated mosquito net (ITN) for every two persons who stayed in the household the previous night' for year 2013 - not at district level (found 5 unique locations)
Skipping indicator 'Households with at least one insecticide-treated mosquito net (ITN) for every two persons who stayed in the household the previous night' for year 2015 - not at district level (found 5 unique locations)
Skipping indicator 'Households with at least one insecticide-treated mosquito net (ITN) for every two persons who stayed in the household the previous night' for year 2017 - not at district level (found 5 unique locations)
Skipping indicator 'Households with at least one insecticide-treated mosquito net (ITN) for every two persons who stayed in the household the previous night' for year 2019 - not at district level (found 5 unique locations)
Skipping indicator 'Households with electricity' for year 2005 - not at district level (found 5 unique locations)
Skipping indicator 'Households with electricity' for year 2008 - not at district level (found 5 unique locations)
Skipping indicator 'Households with electricity' for year 2010 - not at district level (found 5 unique locations)
Skipping indicator 'Households with electricity' for year 2013 - not at district level (found 5 unique locations)
Skipping indicator 'Households with electricity' for year 2015 - not at district level (found 5 unique locations)
Skipping indicator 'Households with electricity' for year 2017 - not at district level (found 5 unique locations)
Skipping indicator 'Households with electricity' for year 2019 - not at district level (found 5 unique locations)
Skipping indicator 'Households with iodized salt' for year 2005 - not at district level (found 5 unique locations)
Skipping indicator 'Households with iodized salt' for year 2010 - not at district level (found 5 unique locations)
Skipping indicator 'Households with iodized salt' for year 2015 - not at district level (found 5 unique locations)
Skipping indicator 'Infant mortality rate' for year 2005 - not at district level (found 5 unique locations)
Skipping indicator 'Infant mortality rate' for year 2008 - not at district level (found 5 unique locations)
Skipping indicator 'Infant mortality rate' for year 2010 - not at district level (found 5 unique locations)
Skipping indicator 'Infant mortality rate' for year 2015 - not at district level (found 5 unique locations)
Skipping indicator 'Infant mortality rate' for year 2019 - not at district level (found 5 unique locations)
Skipping indicator 'Knowledge of prevention of mother to child transmission of HIV [Men]' for year 2005 - not at district level (found 5 unique locations)
Skipping indicator 'Knowledge of prevention of mother to child transmission of HIV [Men]' for year 2010 - not at district level (found 5 unique locations)
Skipping indicator 'Knowledge of prevention of mother to child transmission of HIV [Men]' for year 2015 - not at district level (found 5 unique locations)
Skipping indicator 'Knowledge of prevention of mother to child transmission of HIV [Men]' for year 2019 - not at district level (found 5 unique locations)
Skipping indicator 'Knowledge of prevention of mother to child transmission of HIV [Women]' for year 2005 - not at district level (found 5 unique locations)
Skipping indicator 'Knowledge of prevention of mother to child transmission of HIV [Women]' for year 2010 - not at district level (found 5 unique locations)
Skipping indicator 'Knowledge of prevention of mother to child transmission of HIV [Women]' for year 2015 - not at district level (found 5 unique locations)
Skipping indicator 'Knowledge of prevention of mother to child transmission of HIV [Women]' for year 2019 - not at district level (found 5 unique locations)
Skipping indicator 'Malaria prevalence according to RDT' for year 2010 - not at district level (found 5 unique locations)
Skipping indicator 'Malaria prevalence according to RDT' for year 2015 - not at district level (found 5 unique locations)
Skipping indicator 'Malaria prevalence according to RDT' for year 2017 - not at district level (found 5 unique locations)
Skipping indicator 'Malaria prevalence according to RDT' for year 2019 - not at district level (found 5 unique locations)
Skipping indicator 'Malaria prevalence according to microscopy' for year 2010 - not at district level (found 5 unique locations)
Skipping indicator 'Malaria prevalence according to microscopy' for year 2015 - not at district level (found 5 unique locations)
Skipping indicator 'Malaria prevalence according to microscopy' for year 2017 - not at district level (found 5 unique locations)
Skipping indicator 'Malaria prevalence according to microscopy' for year 2019 - not at district level (found 5 unique locations)
Skipping indicator 'Married women currently using any method of contraception' for year 2005 - not at district level (found 5 unique locations)
Skipping indicator 'Married women currently using any method of contraception' for year 2008 - not at district level (found 5 unique locations)
Skipping indicator 'Married women currently using any method of contraception' for year 2010 - not at district level (found 5 unique locations)
Skipping indicator 'Married women currently using any method of contraception' for year 2015 - not at district level (found 5 unique locations)
Skipping indicator 'Married women currently using any method of contraception' for year 2019 - not at district level (found 5 unique locations)
Skipping indicator 'Married women currently using any modern method of contraception' for year 2005 - not at district level (found 5 unique locations)
Skipping indicator 'Married women currently using any modern method of contraception' for year 2008 - not at district level (found 5 unique locations)
Skipping indicator 'Married women currently using any modern method of contraception' for year 2010 - not at district level (found 5 unique locations)
Skipping indicator 'Married women currently using any modern method of contraception' for year 2015 - not at district level (found 5 unique locations)
Skipping indicator 'Married women currently using any modern method of contraception' for year 2019 - not at district level (found 5 unique locations)
Skipping indicator 'Mean Body Mass Index (BMI) for women' for year 2005 - not at district level (found 5 unique locations)
Skipping indicator 'Mean Body Mass Index (BMI) for women' for year 2010 - not at district level (found 5 unique locations)
Skipping indicator 'Mean Body Mass Index (BMI) for women' for year 2015 - not at district level (found 5 unique locations)
Skipping indicator 'Mean Body Mass Index (BMI) for women' for year 2019 - not at district level (found 5 unique locations)
Skipping indicator 'Mean ideal number of children for all women' for year 2005 - not at district level (found 5 unique locations)
Skipping indicator 'Mean ideal number of children for all women' for year 2008 - not at district level (found 5 unique locations)
Skipping indicator 'Mean ideal number of children for all women' for year 2010 - not at district level (found 5 unique locations)
Skipping indicator 'Mean ideal number of children for all women' for year 2015 - not at district level (found 5 unique locations)
Skipping indicator 'Mean ideal number of children for all women' for year 2019 - not at district level (found 5 unique locations)
Skipping indicator 'Measles vaccination received' for year 2005 - not at district level (found 5 unique locations)
Skipping indicator 'Measles vaccination received' for year 2008 - not at district level (found 5 unique locations)
Skipping indicator 'Measles vaccination received' for year 2010 - not at district level (found 5 unique locations)
Skipping indicator 'Measles vaccination received' for year 2015 - not at district level (found 5 unique locations)
Skipping indicator 'Measles vaccination received' for year 2019 - not at district level (found 5 unique locations)
Skipping indicator 'Median age at first birth for women age 25-49' for year 2005 - not at district level (found 5 unique locations)
Skipping indicator 'Median age at first birth for women age 25-49' for year 2008 - not at district level (found 5 unique locations)
Skipping indicator 'Median age at first birth for women age 25-49' for year 2010 - not at district level (found 5 unique locations)
Skipping indicator 'Median age at first birth for women age 25-49' for year 2015 - not at district level (found 5 unique locations)
Skipping indicator 'Median age at first birth for women age 25-49' for year 2019 - not at district level (found 5 unique locations)
Skipping indicator 'Median age at first marriage [Men]: 25-49(54,59)' for year 2005 - not at district level (found 3 unique locations)
Skipping indicator 'Median age at first marriage [Men]: 25-49(54,59)' for year 2010 - not at district level (found 3 unique locations)
Skipping indicator 'Median age at first marriage [Men]: 25-49(54,59)' for year 2015 - not at district level (found 2 unique locations)
Skipping indicator 'Median age at first marriage [Men]: 25-49(54,59)' for year 2019 - not at district level (found 1 unique locations)
Skipping indicator 'Median age at first marriage [Women]: 25-49' for year 2005 - not at district level (found 5 unique locations)
Skipping indicator 'Median age at first marriage [Women]: 25-49' for year 2010 - not at district level (found 5 unique locations)
Skipping indicator 'Median age at first marriage [Women]: 25-49' for year 2015 - not at district level (found 5 unique locations)
Skipping indicator 'Median age at first marriage [Women]: 25-49' for year 2019 - not at district level (found 5 unique locations)
Skipping indicator 'Median age at first sexual intercourse [Men]: 25-49(54,59)' for year 2005 - not at district level (found 5 unique locations)
Skipping indicator 'Median age at first sexual intercourse [Men]: 25-49(54,59)' for year 2010 - not at district level (found 5 unique locations)
Skipping indicator 'Median age at first sexual intercourse [Men]: 25-49(54,59)' for year 2015 - not at district level (found 5 unique locations)
Skipping indicator 'Median age at first sexual intercourse [Men]: 25-49(54,59)' for year 2019 - not at district level (found 5 unique locations)
Skipping indicator 'Median age at first sexual intercourse [Women]: 25-49' for year 2005 - not at district level (found 5 unique locations)
Skipping indicator 'Median age at first sexual intercourse [Women]: 25-49' for year 2010 - not at district level (found 5 unique locations)
Skipping indicator 'Median age at first sexual intercourse [Women]: 25-49' for year 2015 - not at district level (found 5 unique locations)
Skipping indicator 'Median age at first sexual intercourse [Women]: 25-49' for year 2019 - not at district level (found 5 unique locations)
Skipping indicator 'Median duration of any breastfeeding' for year 2005 - not at district level (found 5 unique locations)
Skipping indicator 'Median duration of any breastfeeding' for year 2008 - not at district level (found 5 unique locations)
Skipping indicator 'Median duration of any breastfeeding' for year 2010 - not at district level (found 5 unique locations)
Skipping indicator 'Median duration of any breastfeeding' for year 2015 - not at district level (found 4 unique locations)
Skipping indicator 'Median duration of any breastfeeding' for year 2019 - not at district level (found 5 unique locations)
Skipping indicator 'Median duration of exclusive breastfeeding' for year 2005 - not at district level (found 5 unique locations)
Skipping indicator 'Median duration of exclusive breastfeeding' for year 2010 - not at district level (found 5 unique locations)
Skipping indicator 'Median duration of exclusive breastfeeding' for year 2015 - not at district level (found 5 unique locations)
Skipping indicator 'Median duration of exclusive breastfeeding' for year 2019 - not at district level (found 5 unique locations)
Skipping indicator 'Median duration of predominant breastfeeding' for year 2005 - not at district level (found 5 unique locations)
Skipping indicator 'Median duration of predominant breastfeeding' for year 2010 - not at district level (found 5 unique locations)
Skipping indicator 'Median duration of predominant breastfeeding' for year 2015 - not at district level (found 5 unique locations)
Skipping indicator 'Median duration of predominant breastfeeding' for year 2019 - not at district level (found 5 unique locations)
Skipping indicator 'Men circumcised' for year 2005 - not at district level (found 5 unique locations)
Skipping indicator 'Men circumcised' for year 2008 - not at district level (found 5 unique locations)
Skipping indicator 'Men circumcised' for year 2010 - not at district level (found 5 unique locations)
Skipping indicator 'Men circumcised' for year 2015 - not at district level (found 5 unique locations)
Skipping indicator 'Men circumcised' for year 2019 - not at district level (found 5 unique locations)
Skipping indicator 'Men receiving an HIV test and receiving test results in the last 12 months' for year 2005 - not at district level (found 5 unique locations)
Skipping indicator 'Men receiving an HIV test and receiving test results in the last 12 months' for year 2010 - not at district level (found 5 unique locations)
Skipping indicator 'Men receiving an HIV test and receiving test results in the last 12 months' for year 2015 - not at district level (found 5 unique locations)
Skipping indicator 'Men receiving an HIV test and receiving test results in the last 12 months' for year 2019 - not at district level (found 5 unique locations)
Skipping indicator 'Men reporting an STI, genital dicharge, or a sore or ulcer' for year 2005 - not at district level (found 5 unique locations)
Skipping indicator 'Men reporting an STI, genital dicharge, or a sore or ulcer' for year 2010 - not at district level (found 5 unique locations)
Skipping indicator 'Men reporting an STI, genital dicharge, or a sore or ulcer' for year 2015 - not at district level (found 5 unique locations)
Skipping indicator 'Men reporting an STI, genital dicharge, or a sore or ulcer' for year 2019 - not at district level (found 5 unique locations)
Skipping indicator 'Men who are literate' for year 2005 - not at district level (found 5 unique locations)
Skipping indicator 'Men who are literate' for year 2010 - not at district level (found 5 unique locations)
Skipping indicator 'Men who are literate' for year 2015 - not at district level (found 5 unique locations)
Skipping indicator 'Men who are literate' for year 2019 - not at district level (found 5 unique locations)
Skipping indicator 'Men who smoke cigarettes' for year 2005 - not at district level (found 5 unique locations)
Skipping indicator 'Men who smoke cigarettes' for year 2010 - not at district level (found 5 unique locations)
Skipping indicator 'Men who smoke cigarettes' for year 2015 - not at district level (found 5 unique locations)
Skipping indicator 'Men who smoke cigarettes' for year 2019 - not at district level (found 5 unique locations)
Skipping indicator 'Men with no education' for year 2005 - not at district level (found 5 unique locations)
Skipping indicator 'Men with no education' for year 2008 - not at district level (found 5 unique locations)
Skipping indicator 'Men with no education' for year 2010 - not at district level (found 5 unique locations)
Skipping indicator 'Men with no education' for year 2015 - not at district level (found 5 unique locations)
Skipping indicator 'Men with no education' for year 2019 - not at district level (found 5 unique locations)
Skipping indicator 'Men with secondary or higher education' for year 2005 - not at district level (found 5 unique locations)
Skipping indicator 'Men with secondary or higher education' for year 2008 - not at district level (found 5 unique locations)
Skipping indicator 'Men with secondary or higher education' for year 2010 - not at district level (found 5 unique locations)
Skipping indicator 'Men with secondary or higher education' for year 2015 - not at district level (found 5 unique locations)
Skipping indicator 'Men with secondary or higher education' for year 2019 - not at district level (found 5 unique locations)
Skipping indicator 'Mother's first postnatal checkup in the first two days after birth' for year 2010 - not at district level (found 5 unique locations)
Skipping indicator 'Mother's first postnatal checkup in the first two days after birth' for year 2015 - not at district level (found 5 unique locations)
Skipping indicator 'Mother's first postnatal checkup in the first two days after birth' for year 2019 - not at district level (found 5 unique locations)
Skipping indicator 'Neonatal mortality rate' for year 2005 - not at district level (found 5 unique locations)
Skipping indicator 'Neonatal mortality rate' for year 2008 - not at district level (found 5 unique locations)
Skipping indicator 'Neonatal mortality rate' for year 2010 - not at district level (found 5 unique locations)
Skipping indicator 'Neonatal mortality rate' for year 2015 - not at district level (found 5 unique locations)
Skipping indicator 'Neonatal mortality rate' for year 2019 - not at district level (found 5 unique locations)
Skipping indicator 'Newborn's first postnatal checkup in the first two days after birth' for year 2010 - not at district level (found 5 unique locations)
Skipping indicator 'Newborn's first postnatal checkup in the first two days after birth' for year 2015 - not at district level (found 5 unique locations)
Skipping indicator 'Newborn's first postnatal checkup in the first two days after birth' for year 2019 - not at district level (found 5 unique locations)
Skipping indicator 'Non-breastfed children 6-23 months with 3 IYCF practices' for year 2010 - not at district level (found 4 unique locations)
Skipping indicator 'Non-breastfed children 6-23 months with 3 IYCF practices' for year 2015 - not at district level (found 4 unique locations)
Skipping indicator 'Non-breastfed children 6-23 months with 3 IYCF practices' for year 2019 - not at district level (found 4 unique locations)
Skipping indicator 'Persons with access to an insecticide-treated mosquito net (ITN)' for year 2005 - not at district level (found 5 unique locations)
Skipping indicator 'Persons with access to an insecticide-treated mosquito net (ITN)' for year 2008 - not at district level (found 5 unique locations)
Skipping indicator 'Persons with access to an insecticide-treated mosquito net (ITN)' for year 2010 - not at district level (found 5 unique locations)
Skipping indicator 'Persons with access to an insecticide-treated mosquito net (ITN)' for year 2013 - not at district level (found 5 unique locations)
Skipping indicator 'Persons with access to an insecticide-treated mosquito net (ITN)' for year 2015 - not at district level (found 5 unique locations)
Skipping indicator 'Persons with access to an insecticide-treated mosquito net (ITN)' for year 2017 - not at district level (found 5 unique locations)
Skipping indicator 'Persons with access to an insecticide-treated mosquito net (ITN)' for year 2019 - not at district level (found 5 unique locations)
Skipping indicator 'Physical or sexual violence committed by husband/partner' for year 2005 - not at district level (found 5 unique locations)
Skipping indicator 'Physical or sexual violence committed by husband/partner' for year 2010 - not at district level (found 5 unique locations)
Skipping indicator 'Physical or sexual violence committed by husband/partner' for year 2015 - not at district level (found 5 unique locations)
Skipping indicator 'Physical or sexual violence committed by husband/partner' for year 2019 - not at district level (found 5 unique locations)
Skipping indicator 'Physical or sexual violence committed by husband/partner in last 12 months' for year 2005 - not at district level (found 5 unique locations)
Skipping indicator 'Physical or sexual violence committed by husband/partner in last 12 months' for year 2010 - not at district level (found 5 unique locations)
Skipping indicator 'Physical or sexual violence committed by husband/partner in last 12 months' for year 2015 - not at district level (found 5 unique locations)
Skipping indicator 'Physical or sexual violence committed by husband/partner in last 12 months' for year 2019 - not at district level (found 5 unique locations)
Skipping indicator 'Place of delivery: Health facility' for year 2005 - not at district level (found 5 unique locations)
Skipping indicator 'Place of delivery: Health facility' for year 2008 - not at district level (found 5 unique locations)
Skipping indicator 'Place of delivery: Health facility' for year 2010 - not at district level (found 5 unique locations)
Skipping indicator 'Place of delivery: Health facility' for year 2015 - not at district level (found 5 unique locations)
Skipping indicator 'Place of delivery: Health facility' for year 2019 - not at district level (found 5 unique locations)
Skipping indicator 'Polio 3 vaccination received' for year 2005 - not at district level (found 5 unique locations)
Skipping indicator 'Polio 3 vaccination received' for year 2008 - not at district level (found 5 unique locations)
Skipping indicator 'Polio 3 vaccination received' for year 2010 - not at district level (found 5 unique locations)
Skipping indicator 'Polio 3 vaccination received' for year 2015 - not at district level (found 5 unique locations)
Skipping indicator 'Polio 3 vaccination received' for year 2019 - not at district level (found 5 unique locations)
Skipping indicator 'Population using an improved water source' for year 2005 - not at district level (found 5 unique locations)
Skipping indicator 'Population using an improved water source' for year 2008 - not at district level (found 5 unique locations)
Skipping indicator 'Population using an improved water source' for year 2010 - not at district level (found 5 unique locations)
Skipping indicator 'Population using an improved water source' for year 2013 - not at district level (found 5 unique locations)
Skipping indicator 'Population using an improved water source' for year 2015 - not at district level (found 5 unique locations)
Skipping indicator 'Population using an improved water source' for year 2017 - not at district level (found 5 unique locations)
Skipping indicator 'Population using an improved water source' for year 2019 - not at district level (found 5 unique locations)
Skipping indicator 'Population who slept under an insecticide-treated mosquito net (ITN) last night' for year 2005 - not at district level (found 5 unique locations)
Skipping indicator 'Population who slept under an insecticide-treated mosquito net (ITN) last night' for year 2008 - not at district level (found 5 unique locations)
Skipping indicator 'Population who slept under an insecticide-treated mosquito net (ITN) last night' for year 2010 - not at district level (found 5 unique locations)
Skipping indicator 'Population who slept under an insecticide-treated mosquito net (ITN) last night' for year 2013 - not at district level (found 5 unique locations)
Skipping indicator 'Population who slept under an insecticide-treated mosquito net (ITN) last night' for year 2015 - not at district level (found 5 unique locations)
Skipping indicator 'Population who slept under an insecticide-treated mosquito net (ITN) last night' for year 2017 - not at district level (found 5 unique locations)
Skipping indicator 'Population who slept under an insecticide-treated mosquito net (ITN) last night' for year 2019 - not at district level (found 5 unique locations)
Skipping indicator 'Population with an improved sanitation facility' for year 2005 - not at district level (found 5 unique locations)
Skipping indicator 'Population with an improved sanitation facility' for year 2008 - not at district level (found 5 unique locations)
Skipping indicator 'Population with an improved sanitation facility' for year 2010 - not at district level (found 5 unique locations)
Skipping indicator 'Population with an improved sanitation facility' for year 2013 - not at district level (found 5 unique locations)
Skipping indicator 'Population with an improved sanitation facility' for year 2015 - not at district level (found 5 unique locations)
Skipping indicator 'Population with an improved sanitation facility' for year 2017 - not at district level (found 5 unique locations)
Skipping indicator 'Population with an improved sanitation facility' for year 2019 - not at district level (found 5 unique locations)
Skipping indicator 'Postneonatal mortality rate' for year 2005 - not at district level (found 5 unique locations)
Skipping indicator 'Postneonatal mortality rate' for year 2008 - not at district level (found 5 unique locations)
Skipping indicator 'Postneonatal mortality rate' for year 2010 - not at district level (found 5 unique locations)
Skipping indicator 'Postneonatal mortality rate' for year 2015 - not at district level (found 5 unique locations)
Skipping indicator 'Postneonatal mortality rate' for year 2019 - not at district level (found 5 unique locations)
Skipping indicator 'Pregnant women who slept under an insecticide-treated net (ITN)' for year 2005 - not at district level (found 5 unique locations)
Skipping indicator 'Pregnant women who slept under an insecticide-treated net (ITN)' for year 2008 - not at district level (found 5 unique locations)
Skipping indicator 'Pregnant women who slept under an insecticide-treated net (ITN)' for year 2010 - not at district level (found 5 unique locations)
Skipping indicator 'Pregnant women who slept under an insecticide-treated net (ITN)' for year 2013 - not at district level (found 5 unique locations)
Skipping indicator 'Pregnant women who slept under an insecticide-treated net (ITN)' for year 2015 - not at district level (found 5 unique locations)
Skipping indicator 'Pregnant women who slept under an insecticide-treated net (ITN)' for year 2017 - not at district level (found 5 unique locations)
Skipping indicator 'Pregnant women who slept under an insecticide-treated net (ITN)' for year 2019 - not at district level (found 5 unique locations)
Skipping indicator 'Prevalence of orphanhood: children under 18 who are orphans - mother, father or both dead' for year 2005 - not at district level (found 5 unique locations)
Skipping indicator 'Prevalence of orphanhood: children under 18 who are orphans - mother, father or both dead' for year 2010 - not at district level (found 5 unique locations)
Skipping indicator 'Prevalence of orphanhood: children under 18 who are orphans - mother, father or both dead' for year 2015 - not at district level (found 5 unique locations)
Skipping indicator 'Prevalence of orphanhood: children under 18 who are orphans - mother, father or both dead' for year 2019 - not at district level (found 5 unique locations)
Skipping indicator 'SP/Fansidar 3+ doses during pregnancy' for year 2005 - not at district level (found 5 unique locations)
Skipping indicator 'SP/Fansidar 3+ doses during pregnancy' for year 2008 - not at district level (found 5 unique locations)
Skipping indicator 'Tetanus protection at birth' for year 2008 - not at district level (found 5 unique locations)
Skipping indicator 'Tetanus protection at birth' for year 2010 - not at district level (found 5 unique locations)
Skipping indicator 'Tetanus protection at birth' for year 2015 - not at district level (found 5 unique locations)
Skipping indicator 'Tetanus protection at birth' for year 2019 - not at district level (found 5 unique locations)
Skipping indicator 'Total fertility rate 15-49' for year 2005 - not at district level (found 5 unique locations)
Skipping indicator 'Total fertility rate 15-49' for year 2008 - not at district level (found 5 unique locations)
Skipping indicator 'Total fertility rate 15-49' for year 2010 - not at district level (found 5 unique locations)
Skipping indicator 'Total fertility rate 15-49' for year 2013 - not at district level (found 5 unique locations)
Skipping indicator 'Total fertility rate 15-49' for year 2015 - not at district level (found 5 unique locations)
Skipping indicator 'Total fertility rate 15-49' for year 2017 - not at district level (found 5 unique locations)
Skipping indicator 'Total fertility rate 15-49' for year 2019 - not at district level (found 5 unique locations)
Skipping indicator 'Total wanted fertility rate' for year 2005 - not at district level (found 5 unique locations)
Skipping indicator 'Total wanted fertility rate' for year 2008 - not at district level (found 5 unique locations)
Skipping indicator 'Total wanted fertility rate' for year 2010 - not at district level (found 5 unique locations)
Skipping indicator 'Total wanted fertility rate' for year 2015 - not at district level (found 5 unique locations)
Skipping indicator 'Total wanted fertility rate' for year 2019 - not at district level (found 5 unique locations)
Skipping indicator 'Treatment of diarrhea: Either ORS or RHF' for year 2005 - not at district level (found 5 unique locations)
Skipping indicator 'Treatment of diarrhea: Either ORS or RHF' for year 2008 - not at district level (found 5 unique locations)
Skipping indicator 'Treatment of diarrhea: Either ORS or RHF' for year 2010 - not at district level (found 5 unique locations)
Skipping indicator 'Treatment of diarrhea: Either ORS or RHF' for year 2015 - not at district level (found 5 unique locations)
Skipping indicator 'Treatment of diarrhea: Either ORS or RHF' for year 2019 - not at district level (found 5 unique locations)
Skipping indicator 'Under-five mortality rate' for year 2005 - not at district level (found 5 unique locations)
Skipping indicator 'Under-five mortality rate' for year 2008 - not at district level (found 5 unique locations)
Skipping indicator 'Under-five mortality rate' for year 2010 - not at district level (found 5 unique locations)
Skipping indicator 'Under-five mortality rate' for year 2015 - not at district level (found 5 unique locations)
Skipping indicator 'Under-five mortality rate' for year 2019 - not at district level (found 5 unique locations)
Skipping indicator 'Unmet need for family planning' for year 2005 - not at district level (found 5 unique locations)
Skipping indicator 'Unmet need for family planning' for year 2008 - not at district level (found 5 unique locations)
Skipping indicator 'Unmet need for family planning' for year 2010 - not at district level (found 5 unique locations)
Skipping indicator 'Unmet need for family planning' for year 2015 - not at district level (found 5 unique locations)
Skipping indicator 'Unmet need for family planning' for year 2019 - not at district level (found 5 unique locations)
Skipping indicator 'Wife beating justified for at least one specific reason [Men]' for year 2005 - not at district level (found 5 unique locations)
Skipping indicator 'Wife beating justified for at least one specific reason [Men]' for year 2010 - not at district level (found 5 unique locations)
Skipping indicator 'Wife beating justified for at least one specific reason [Men]' for year 2015 - not at district level (found 5 unique locations)
Skipping indicator 'Wife beating justified for at least one specific reason [Men]' for year 2019 - not at district level (found 5 unique locations)
Skipping indicator 'Wife beating justified for at least one specific reason [Women]' for year 2005 - not at district level (found 5 unique locations)
Skipping indicator 'Wife beating justified for at least one specific reason [Women]' for year 2010 - not at district level (found 5 unique locations)
Skipping indicator 'Wife beating justified for at least one specific reason [Women]' for year 2015 - not at district level (found 5 unique locations)
Skipping indicator 'Wife beating justified for at least one specific reason [Women]' for year 2019 - not at district level (found 5 unique locations)
Skipping indicator 'Women receiving an HIV test and receiving test results in the last 12 months' for year 2005 - not at district level (found 5 unique locations)
Skipping indicator 'Women receiving an HIV test and receiving test results in the last 12 months' for year 2010 - not at district level (found 5 unique locations)
Skipping indicator 'Women receiving an HIV test and receiving test results in the last 12 months' for year 2015 - not at district level (found 5 unique locations)
Skipping indicator 'Women receiving an HIV test and receiving test results in the last 12 months' for year 2019 - not at district level (found 5 unique locations)
Skipping indicator 'Women reporting an STI, genital dicharge, or a sore or ulcer' for year 2005 - not at district level (found 5 unique locations)
Skipping indicator 'Women reporting an STI, genital dicharge, or a sore or ulcer' for year 2010 - not at district level (found 5 unique locations)
Skipping indicator 'Women reporting an STI, genital dicharge, or a sore or ulcer' for year 2015 - not at district level (found 5 unique locations)
Skipping indicator 'Women reporting an STI, genital dicharge, or a sore or ulcer' for year 2019 - not at district level (found 5 unique locations)
Skipping indicator 'Women who are literate' for year 2005 - not at district level (found 5 unique locations)
Skipping indicator 'Women who are literate' for year 2010 - not at district level (found 5 unique locations)
Skipping indicator 'Women who are literate' for year 2013 - not at district level (found 5 unique locations)
Skipping indicator 'Women who are literate' for year 2015 - not at district level (found 5 unique locations)
Skipping indicator 'Women who are literate' for year 2017 - not at district level (found 5 unique locations)
Skipping indicator 'Women who are literate' for year 2019 - not at district level (found 5 unique locations)
Skipping indicator 'Women who are overweight or obese according to BMI (>=25.0)' for year 2005 - not at district level (found 5 unique locations)
Skipping indicator 'Women who are overweight or obese according to BMI (>=25.0)' for year 2010 - not at district level (found 5 unique locations)
Skipping indicator 'Women who are overweight or obese according to BMI (>=25.0)' for year 2015 - not at district level (found 5 unique locations)
Skipping indicator 'Women who are overweight or obese according to BMI (>=25.0)' for year 2019 - not at district level (found 5 unique locations)
Skipping indicator 'Women who are thin according to BMI (<18.5)' for year 2005 - not at district level (found 5 unique locations)
Skipping indicator 'Women who are thin according to BMI (<18.5)' for year 2010 - not at district level (found 5 unique locations)
Skipping indicator 'Women who are thin according to BMI (<18.5)' for year 2015 - not at district level (found 5 unique locations)
Skipping indicator 'Women who are thin according to BMI (<18.5)' for year 2019 - not at district level (found 5 unique locations)
Skipping indicator 'Women who decide themselves how their earnings are used' for year 2005 - not at district level (found 5 unique locations)
Skipping indicator 'Women who decide themselves how their earnings are used' for year 2010 - not at district level (found 5 unique locations)
Skipping indicator 'Women who decide themselves how their earnings are used' for year 2015 - not at district level (found 5 unique locations)
Skipping indicator 'Women who decide themselves how their earnings are used' for year 2019 - not at district level (found 5 unique locations)
Skipping indicator 'Women who ever experienced sexual violence' for year 2005 - not at district level (found 5 unique locations)
Skipping indicator 'Women who ever experienced sexual violence' for year 2010 - not at district level (found 5 unique locations)
Skipping indicator 'Women who ever experienced sexual violence' for year 2015 - not at district level (found 5 unique locations)
Skipping indicator 'Women who ever experienced sexual violence' for year 2019 - not at district level (found 5 unique locations)
Skipping indicator 'Women who smoke cigarettes' for year 2005 - not at district level (found 5 unique locations)
Skipping indicator 'Women who smoke cigarettes' for year 2010 - not at district level (found 5 unique locations)
Skipping indicator 'Women who smoke cigarettes' for year 2015 - not at district level (found 5 unique locations)
Skipping indicator 'Women who smoke cigarettes' for year 2019 - not at district level (found 5 unique locations)
Skipping indicator 'Women who want no more children' for year 2005 - not at district level (found 5 unique locations)
Skipping indicator 'Women who want no more children' for year 2008 - not at district level (found 5 unique locations)
Skipping indicator 'Women who want no more children' for year 2010 - not at district level (found 5 unique locations)
Skipping indicator 'Women who want no more children' for year 2015 - not at district level (found 5 unique locations)
Skipping indicator 'Women who want no more children' for year 2019 - not at district level (found 5 unique locations)
Skipping indicator 'Women with any anemia' for year 2005 - not at district level (found 5 unique locations)
Skipping indicator 'Women with any anemia' for year 2008 - not at district level (found 5 unique locations)
Skipping indicator 'Women with any anemia' for year 2010 - not at district level (found 5 unique locations)
Skipping indicator 'Women with any anemia' for year 2015 - not at district level (found 5 unique locations)
Skipping indicator 'Women with any anemia' for year 2019 - not at district level (found 5 unique locations)
Skipping indicator 'Women with no education' for year 2005 - not at district level (found 5 unique locations)
Skipping indicator 'Women with no education' for year 2008 - not at district level (found 5 unique locations)
Skipping indicator 'Women with no education' for year 2010 - not at district level (found 5 unique locations)
Skipping indicator 'Women with no education' for year 2013 - not at district level (found 5 unique locations)
Skipping indicator 'Women with no education' for year 2015 - not at district level (found 5 unique locations)
Skipping indicator 'Women with no education' for year 2017 - not at district level (found 5 unique locations)
Skipping indicator 'Women with no education' for year 2019 - not at district level (found 5 unique locations)
Skipping indicator 'Women with secondary or higher education' for year 2005 - not at district level (found 5 unique locations)
Skipping indicator 'Women with secondary or higher education' for year 2008 - not at district level (found 5 unique locations)
Skipping indicator 'Women with secondary or higher education' for year 2010 - not at district level (found 5 unique locations)
Skipping indicator 'Women with secondary or higher education' for year 2013 - not at district level (found 5 unique locations)
Skipping indicator 'Women with secondary or higher education' for year 2015 - not at district level (found 5 unique locations)
Skipping indicator 'Women with secondary or higher education' for year 2017 - not at district level (found 5 unique locations)
Skipping indicator 'Women with secondary or higher education' for year 2019 - not at district level (found 5 unique locations)
Skipping indicator 'Antenatal care from a skilled provider' for year 2005 - not at district level (found 5 unique locations)
Skipping indicator 'Antenatal care from a skilled provider' for year 2008 - not at district level (found 5 unique locations)
Skipping indicator 'Antenatal care from a skilled provider' for year 2010 - not at district level (found 5 unique locations)
Skipping indicator 'Antenatal care from a skilled provider' for year 2013 - not at district level (found 5 unique locations)
Skipping indicator 'Antenatal care from a skilled provider' for year 2015 - not at district level (found 5 unique locations)
Skipping indicator 'Antenatal care from a skilled provider' for year 2017 - not at district level (found 5 unique locations)
Skipping indicator 'Antenatal care from a skilled provider' for year 2019 - not at district level (found 5 unique locations)
Skipping indicator 'Antenatal care provider: Auxiliary nurse/midwife' for year 2010 - not at district level (found 5 unique locations)
Skipping indicator 'Antenatal care provider: Auxiliary nurse/midwife' for year 2013 - not at district level (found 5 unique locations)
Skipping indicator 'Antenatal care provider: Auxiliary nurse/midwife' for year 2015 - not at district level (found 5 unique locations)
Skipping indicator 'Antenatal care provider: Auxiliary nurse/midwife' for year 2017 - not at district level (found 5 unique locations)
Skipping indicator 'Antenatal care provider: Auxiliary nurse/midwife' for year 2019 - not at district level (found 5 unique locations)
Skipping indicator 'Antenatal care provider: Doctor' for year 2005 - not at district level (found 5 unique locations)
Skipping indicator 'Antenatal care provider: Doctor' for year 2008 - not at district level (found 5 unique locations)
Skipping indicator 'Antenatal care provider: Doctor' for year 2010 - not at district level (found 5 unique locations)
Skipping indicator 'Antenatal care provider: Doctor' for year 2013 - not at district level (found 5 unique locations)
Skipping indicator 'Antenatal care provider: Doctor' for year 2015 - not at district level (found 5 unique locations)
Skipping indicator 'Antenatal care provider: Doctor' for year 2017 - not at district level (found 5 unique locations)
Skipping indicator 'Antenatal care provider: Doctor' for year 2019 - not at district level (found 5 unique locations)
Skipping indicator 'Antenatal care provider: Missing ' for year 2005 - not at district level (found 5 unique locations)
Skipping indicator 'Antenatal care provider: Missing ' for year 2008 - not at district level (found 5 unique locations)
Skipping indicator 'Antenatal care provider: Missing ' for year 2010 - not at district level (found 5 unique locations)
Skipping indicator 'Antenatal care provider: Missing ' for year 2015 - not at district level (found 5 unique locations)
Skipping indicator 'Antenatal care provider: Missing ' for year 2017 - not at district level (found 5 unique locations)
Skipping indicator 'Antenatal care provider: Nurse/midwife' for year 2005 - not at district level (found 5 unique locations)
Skipping indicator 'Antenatal care provider: Nurse/midwife' for year 2008 - not at district level (found 5 unique locations)
Skipping indicator 'Antenatal care provider: Nurse/midwife' for year 2010 - not at district level (found 5 unique locations)
Skipping indicator 'Antenatal care provider: Nurse/midwife' for year 2013 - not at district level (found 5 unique locations)
Skipping indicator 'Antenatal care provider: Nurse/midwife' for year 2015 - not at district level (found 5 unique locations)
Skipping indicator 'Antenatal care provider: Nurse/midwife' for year 2017 - not at district level (found 5 unique locations)
Skipping indicator 'Antenatal care provider: Nurse/midwife' for year 2019 - not at district level (found 5 unique locations)
Skipping indicator 'Antenatal care provider: Other' for year 2008 - not at district level (found 5 unique locations)
Skipping indicator 'Antenatal care provider: Other' for year 2010 - not at district level (found 5 unique locations)
Skipping indicator 'Antenatal care provider: Other' for year 2015 - not at district level (found 5 unique locations)
Skipping indicator 'Antenatal care provider: Other' for year 2017 - not at district level (found 5 unique locations)
Skipping indicator 'Antenatal care provider: Other health worker' for year 2005 - not at district level (found 5 unique locations)
Skipping indicator 'Antenatal care provider: Traditional birth attendant' for year 2005 - not at district level (found 5 unique locations)
Skipping indicator 'Antenatal care provider: Traditional birth attendant' for year 2008 - not at district level (found 5 unique locations)
Skipping indicator 'Antenatal care provider: Traditional birth attendant' for year 2010 - not at district level (found 5 unique locations)
Skipping indicator 'Antenatal care provider: Traditional birth attendant' for year 2015 - not at district level (found 5 unique locations)
Skipping indicator 'Antenatal care: Total' for year 2005 - not at district level (found 5 unique locations)
Skipping indicator 'Antenatal care: Total' for year 2008 - not at district level (found 5 unique locations)
Skipping indicator 'Antenatal care: Total' for year 2010 - not at district level (found 5 unique locations)
Skipping indicator 'Antenatal care: Total' for year 2013 - not at district level (found 5 unique locations)
Skipping indicator 'Antenatal care: Total' for year 2015 - not at district level (found 5 unique locations)
Skipping indicator 'Antenatal care: Total' for year 2017 - not at district level (found 5 unique locations)
Skipping indicator 'Antenatal care: Total' for year 2019 - not at district level (found 5 unique locations)
Skipping indicator 'Assistance during delivery from a skilled provider' for year 2005 - not at district level (found 5 unique locations)
Skipping indicator 'Assistance during delivery from a skilled provider' for year 2008 - not at district level (found 5 unique locations)
Skipping indicator 'Assistance during delivery from a skilled provider' for year 2010 - not at district level (found 5 unique locations)
Skipping indicator 'Assistance during delivery from a skilled provider' for year 2015 - not at district level (found 5 unique locations)
Skipping indicator 'Assistance during delivery from a skilled provider' for year 2019 - not at district level (found 5 unique locations)
Skipping indicator 'Assistance during delivery: Auxiliary nurse/midwife' for year 2008 - not at district level (found 5 unique locations)
Skipping indicator 'Assistance during delivery: Auxiliary nurse/midwife' for year 2010 - not at district level (found 5 unique locations)
Skipping indicator 'Assistance during delivery: Auxiliary nurse/midwife' for year 2015 - not at district level (found 5 unique locations)
Skipping indicator 'Assistance during delivery: Auxiliary nurse/midwife' for year 2019 - not at district level (found 5 unique locations)
Skipping indicator 'Assistance during delivery: Doctor' for year 2005 - not at district level (found 5 unique locations)
Skipping indicator 'Assistance during delivery: Doctor' for year 2008 - not at district level (found 5 unique locations)
Skipping indicator 'Assistance during delivery: Doctor' for year 2010 - not at district level (found 5 unique locations)
Skipping indicator 'Assistance during delivery: Doctor' for year 2015 - not at district level (found 5 unique locations)
Skipping indicator 'Assistance during delivery: Doctor' for year 2019 - not at district level (found 5 unique locations)
Skipping indicator 'Assistance during delivery: No one' for year 2005 - not at district level (found 5 unique locations)
Skipping indicator 'Assistance during delivery: No one' for year 2008 - not at district level (found 5 unique locations)
Skipping indicator 'Assistance during delivery: No one' for year 2010 - not at district level (found 5 unique locations)
Skipping indicator 'Assistance during delivery: No one' for year 2015 - not at district level (found 5 unique locations)
Skipping indicator 'Assistance during delivery: No one' for year 2019 - not at district level (found 5 unique locations)
Skipping indicator 'Assistance during delivery: Nurse/midwife' for year 2005 - not at district level (found 5 unique locations)
Skipping indicator 'Assistance during delivery: Nurse/midwife' for year 2008 - not at district level (found 5 unique locations)
Skipping indicator 'Assistance during delivery: Nurse/midwife' for year 2010 - not at district level (found 5 unique locations)
Skipping indicator 'Assistance during delivery: Nurse/midwife' for year 2015 - not at district level (found 5 unique locations)
Skipping indicator 'Assistance during delivery: Nurse/midwife' for year 2019 - not at district level (found 5 unique locations)
Skipping indicator 'Assistance during delivery: Other health worker' for year 2005 - not at district level (found 5 unique locations)
Skipping indicator 'Assistance during delivery: Other health worker' for year 2019 - not at district level (found 5 unique locations)
Skipping indicator 'Assistance during delivery: Relative or other' for year 2005 - not at district level (found 5 unique locations)
Skipping indicator 'Assistance during delivery: Relative or other' for year 2008 - not at district level (found 5 unique locations)
Skipping indicator 'Assistance during delivery: Relative or other' for year 2010 - not at district level (found 5 unique locations)
Skipping indicator 'Assistance during delivery: Relative or other' for year 2015 - not at district level (found 5 unique locations)
Skipping indicator 'Assistance during delivery: Relative or other' for year 2019 - not at district level (found 5 unique locations)
Skipping indicator 'Assistance during delivery: Total' for year 2005 - not at district level (found 5 unique locations)
Skipping indicator 'Assistance during delivery: Total' for year 2008 - not at district level (found 5 unique locations)
Skipping indicator 'Assistance during delivery: Total' for year 2010 - not at district level (found 5 unique locations)
Skipping indicator 'Assistance during delivery: Total' for year 2015 - not at district level (found 5 unique locations)
Skipping indicator 'Assistance during delivery: Total' for year 2019 - not at district level (found 5 unique locations)
Skipping indicator 'Assistance during delivery: Traditional birth attendant' for year 2005 - not at district level (found 5 unique locations)
Skipping indicator 'Assistance during delivery: Traditional birth attendant' for year 2008 - not at district level (found 5 unique locations)
Skipping indicator 'Assistance during delivery: Traditional birth attendant' for year 2010 - not at district level (found 5 unique locations)
Skipping indicator 'Assistance during delivery: Traditional birth attendant' for year 2015 - not at district level (found 5 unique locations)
Skipping indicator 'Assistance during delivery: Traditional birth attendant' for year 2019 - not at district level (found 5 unique locations)
Skipping indicator 'Assistance during delivery: don't know or missing' for year 2005 - not at district level (found 5 unique locations)
Skipping indicator 'Assistance during delivery: don't know or missing' for year 2008 - not at district level (found 5 unique locations)
Skipping indicator 'Assistance during delivery: don't know or missing' for year 2010 - not at district level (found 5 unique locations)
Skipping indicator 'Assistance during delivery: don't know or missing' for year 2015 - not at district level (found 5 unique locations)
Skipping indicator 'Child took antibiotic drugs for fever' for year 2008 - not at district level (found 5 unique locations)
Skipping indicator 'Child took antibiotic drugs for fever' for year 2010 - not at district level (found 5 unique locations)
Skipping indicator 'Child took antibiotic drugs for fever' for year 2013 - not at district level (found 5 unique locations)
Skipping indicator 'Child took antibiotic drugs for fever' for year 2015 - not at district level (found 5 unique locations)
Skipping indicator 'Child took antibiotic drugs for fever' for year 2017 - not at district level (found 5 unique locations)
Skipping indicator 'Child took antibiotic drugs for fever' for year 2019 - not at district level (found 5 unique locations)
Skipping indicator 'Child took antimalarial drugs for fever' for year 2005 - not at district level (found 5 unique locations)
Skipping indicator 'Child took antimalarial drugs for fever' for year 2008 - not at district level (found 5 unique locations)
Skipping indicator 'Child took antimalarial drugs for fever' for year 2010 - not at district level (found 5 unique locations)
Skipping indicator 'Child took antimalarial drugs for fever' for year 2013 - not at district level (found 5 unique locations)
Skipping indicator 'Child took antimalarial drugs for fever' for year 2015 - not at district level (found 5 unique locations)
Skipping indicator 'Child took antimalarial drugs for fever' for year 2017 - not at district level (found 5 unique locations)
Skipping indicator 'Child took antimalarial drugs for fever' for year 2019 - not at district level (found 5 unique locations)
Skipping indicator 'Children with ARI for whom advice or treatment was sought' for year 2005 - not at district level (found 5 unique locations)
Skipping indicator 'Children with ARI for whom advice or treatment was sought' for year 2008 - not at district level (found 5 unique locations)
Skipping indicator 'Children with ARI for whom advice or treatment was sought' for year 2010 - not at district level (found 5 unique locations)
Skipping indicator 'Children with ARI for whom advice or treatment was sought' for year 2015 - not at district level (found 5 unique locations)
Skipping indicator 'Children with ARI for whom advice or treatment was sought' for year 2019 - not at district level (found 2 unique locations)
Skipping indicator 'Children with fever for whom advice or treatment was sought' for year 2005 - not at district level (found 5 unique locations)
Skipping indicator 'Children with fever for whom advice or treatment was sought' for year 2008 - not at district level (found 5 unique locations)
Skipping indicator 'Children with fever for whom advice or treatment was sought' for year 2010 - not at district level (found 5 unique locations)
Skipping indicator 'Children with fever for whom advice or treatment was sought' for year 2013 - not at district level (found 5 unique locations)
Skipping indicator 'Children with fever for whom advice or treatment was sought' for year 2015 - not at district level (found 5 unique locations)
Skipping indicator 'Children with fever for whom advice or treatment was sought' for year 2017 - not at district level (found 5 unique locations)
Skipping indicator 'Children with fever for whom advice or treatment was sought' for year 2019 - not at district level (found 5 unique locations)
Skipping indicator 'Children with symptoms of ARI' for year 2005 - not at district level (found 5 unique locations)
Skipping indicator 'Children with symptoms of ARI' for year 2008 - not at district level (found 5 unique locations)
Skipping indicator 'Children with symptoms of ARI' for year 2010 - not at district level (found 5 unique locations)
Skipping indicator 'Children with symptoms of ARI' for year 2015 - not at district level (found 5 unique locations)
Skipping indicator 'Children with symptoms of ARI' for year 2019 - not at district level (found 5 unique locations)
Skipping indicator 'Children with symptoms of ARI who received antibiotics' for year 2008 - not at district level (found 5 unique locations)
Skipping indicator 'Children with symptoms of ARI who received antibiotics' for year 2010 - not at district level (found 5 unique locations)
Skipping indicator 'Children with symptoms of ARI who received antibiotics' for year 2015 - not at district level (found 5 unique locations)
Skipping indicator 'Children with symptoms of ARI who received antibiotics' for year 2019 - not at district level (found 2 unique locations)
Skipping indicator 'Delivery by cesarean section' for year 2005 - not at district level (found 5 unique locations)
Skipping indicator 'Delivery by cesarean section' for year 2010 - not at district level (found 5 unique locations)
Skipping indicator 'Delivery by cesarean section' for year 2015 - not at district level (found 5 unique locations)
Skipping indicator 'Delivery by cesarean section' for year 2019 - not at district level (found 5 unique locations)
Skipping indicator 'No antenatal care' for year 2005 - not at district level (found 5 unique locations)
Skipping indicator 'No antenatal care' for year 2008 - not at district level (found 5 unique locations)
Skipping indicator 'No antenatal care' for year 2010 - not at district level (found 5 unique locations)
Skipping indicator 'No antenatal care' for year 2013 - not at district level (found 5 unique locations)
Skipping indicator 'No antenatal care' for year 2015 - not at district level (found 5 unique locations)
Skipping indicator 'No antenatal care' for year 2017 - not at district level (found 5 unique locations)
Skipping indicator 'No antenatal care' for year 2019 - not at district level (found 5 unique locations)
Skipping indicator 'No postnatal checkup for mother within first two days of birth' for year 2010 - not at district level (found 5 unique locations)
Skipping indicator 'No postnatal checkup for mother within first two days of birth' for year 2015 - not at district level (found 5 unique locations)
Skipping indicator 'No postnatal checkup for mother within first two days of birth' for year 2019 - not at district level (found 5 unique locations)
Skipping indicator 'No postnatal checkup for newborn within first two days of birth' for year 2010 - not at district level (found 5 unique locations)
Skipping indicator 'No postnatal checkup for newborn within first two days of birth' for year 2015 - not at district level (found 5 unique locations)
Skipping indicator 'No postnatal checkup for newborn within first two days of birth' for year 2019 - not at district level (found 5 unique locations)
Skipping indicator 'Number of children born in the last five (or three) years' for year 2005 - not at district level (found 5 unique locations)
Skipping indicator 'Number of children born in the last five (or three) years' for year 2008 - not at district level (found 5 unique locations)
Skipping indicator 'Number of children born in the last five (or three) years' for year 2010 - not at district level (found 5 unique locations)
Skipping indicator 'Number of children born in the last five (or three) years' for year 2015 - not at district level (found 5 unique locations)
Skipping indicator 'Number of children born in the last five (or three) years' for year 2019 - not at district level (found 5 unique locations)
Skipping indicator 'Number of children born in the last five (or three) years (unweighted)' for year 2005 - not at district level (found 5 unique locations)
Skipping indicator 'Number of children born in the last five (or three) years (unweighted)' for year 2008 - not at district level (found 5 unique locations)
Skipping indicator 'Number of children born in the last five (or three) years (unweighted)' for year 2010 - not at district level (found 5 unique locations)
Skipping indicator 'Number of children born in the last five (or three) years (unweighted)' for year 2015 - not at district level (found 5 unique locations)
Skipping indicator 'Number of children born in the last five (or three) years (unweighted)' for year 2019 - not at district level (found 5 unique locations)
Skipping indicator 'Number of children with fever in the last two weeks' for year 2005 - not at district level (found 5 unique locations)
Skipping indicator 'Number of children with fever in the last two weeks' for year 2008 - not at district level (found 5 unique locations)
Skipping indicator 'Number of children with fever in the last two weeks' for year 2010 - not at district level (found 5 unique locations)
Skipping indicator 'Number of children with fever in the last two weeks' for year 2013 - not at district level (found 5 unique locations)
Skipping indicator 'Number of children with fever in the last two weeks' for year 2015 - not at district level (found 5 unique locations)
Skipping indicator 'Number of children with fever in the last two weeks' for year 2017 - not at district level (found 5 unique locations)
Skipping indicator 'Number of children with fever in the last two weeks' for year 2019 - not at district level (found 5 unique locations)
Skipping indicator 'Number of children with fever in the last two weeks (unweighted)' for year 2005 - not at district level (found 5 unique locations)
Skipping indicator 'Number of children with fever in the last two weeks (unweighted)' for year 2008 - not at district level (found 5 unique locations)
Skipping indicator 'Number of children with fever in the last two weeks (unweighted)' for year 2010 - not at district level (found 5 unique locations)
Skipping indicator 'Number of children with fever in the last two weeks (unweighted)' for year 2013 - not at district level (found 5 unique locations)
Skipping indicator 'Number of children with fever in the last two weeks (unweighted)' for year 2015 - not at district level (found 5 unique locations)
Skipping indicator 'Number of children with fever in the last two weeks (unweighted)' for year 2017 - not at district level (found 5 unique locations)
Skipping indicator 'Number of children with fever in the last two weeks (unweighted)' for year 2019 - not at district level (found 5 unique locations)
Skipping indicator 'Number of children with symptoms of ARI born in the last five (or three) years' for year 2005 - not at district level (found 5 unique locations)
Skipping indicator 'Number of children with symptoms of ARI born in the last five (or three) years' for year 2008 - not at district level (found 5 unique locations)
Skipping indicator 'Number of children with symptoms of ARI born in the last five (or three) years' for year 2010 - not at district level (found 5 unique locations)
Skipping indicator 'Number of children with symptoms of ARI born in the last five (or three) years' for year 2015 - not at district level (found 5 unique locations)
Skipping indicator 'Number of children with symptoms of ARI born in the last five (or three) years' for year 2019 - not at district level (found 2 unique locations)
Skipping indicator 'Number of children with symptoms of ARI born in the last five (or three) years (unweighted)' for year 2005 - not at district level (found 5 unique locations)
Skipping indicator 'Number of children with symptoms of ARI born in the last five (or three) years (unweighted)' for year 2008 - not at district level (found 5 unique locations)
Skipping indicator 'Number of children with symptoms of ARI born in the last five (or three) years (unweighted)' for year 2010 - not at district level (found 5 unique locations)
Skipping indicator 'Number of children with symptoms of ARI born in the last five (or three) years (unweighted)' for year 2015 - not at district level (found 5 unique locations)
Skipping indicator 'Number of children with symptoms of ARI born in the last five (or three) years (unweighted)' for year 2019 - not at district level (found 5 unique locations)
Skipping indicator 'Number of live births (or stillbirths) in the last two (or three/five) years' for year 2005 - not at district level (found 5 unique locations)
Skipping indicator 'Number of live births (or stillbirths) in the last two (or three/five) years' for year 2008 - not at district level (found 5 unique locations)
Skipping indicator 'Number of live births (or stillbirths) in the last two (or three/five) years' for year 2010 - not at district level (found 5 unique locations)
Skipping indicator 'Number of live births (or stillbirths) in the last two (or three/five) years' for year 2015 - not at district level (found 5 unique locations)
Skipping indicator 'Number of live births (or stillbirths) in the last two (or three/five) years' for year 2019 - not at district level (found 5 unique locations)
Skipping indicator 'Number of live births (or stillbirths) in the last two (or three/five) years (unweighted)' for year 2005 - not at district level (found 5 unique locations)
Skipping indicator 'Number of live births (or stillbirths) in the last two (or three/five) years (unweighted)' for year 2008 - not at district level (found 5 unique locations)
Skipping indicator 'Number of live births (or stillbirths) in the last two (or three/five) years (unweighted)' for year 2010 - not at district level (found 5 unique locations)
Skipping indicator 'Number of live births (or stillbirths) in the last two (or three/five) years (unweighted)' for year 2015 - not at district level (found 5 unique locations)
Skipping indicator 'Number of live births (or stillbirths) in the last two (or three/five) years (unweighted)' for year 2019 - not at district level (found 5 unique locations)
Skipping indicator 'Number of mothers' for year 2010 - not at district level (found 5 unique locations)
Skipping indicator 'Number of mothers' for year 2015 - not at district level (found 5 unique locations)
Skipping indicator 'Number of mothers' for year 2019 - not at district level (found 5 unique locations)
Skipping indicator 'Number of mothers (unweighted)' for year 2010 - not at district level (found 5 unique locations)
Skipping indicator 'Number of mothers (unweighted)' for year 2015 - not at district level (found 5 unique locations)
Skipping indicator 'Number of mothers (unweighted)' for year 2019 - not at district level (found 5 unique locations)
Skipping indicator 'Number of newborns' for year 2010 - not at district level (found 5 unique locations)
Skipping indicator 'Number of newborns' for year 2015 - not at district level (found 5 unique locations)
Skipping indicator 'Number of newborns' for year 2019 - not at district level (found 5 unique locations)
Skipping indicator 'Number of newborns (unweighted)' for year 2010 - not at district level (found 5 unique locations)
Skipping indicator 'Number of newborns (unweighted)' for year 2015 - not at district level (found 5 unique locations)
Skipping indicator 'Number of newborns (unweighted)' for year 2019 - not at district level (found 5 unique locations)
Skipping indicator 'Number of women with a live birth (or stillbirth) in the last two (or three/five) years' for year 2005 - not at district level (found 5 unique locations)
Skipping indicator 'Number of women with a live birth (or stillbirth) in the last two (or three/five) years' for year 2008 - not at district level (found 5 unique locations)
Skipping indicator 'Number of women with a live birth (or stillbirth) in the last two (or three/five) years' for year 2010 - not at district level (found 5 unique locations)
Skipping indicator 'Number of women with a live birth (or stillbirth) in the last two (or three/five) years' for year 2013 - not at district level (found 5 unique locations)
Skipping indicator 'Number of women with a live birth (or stillbirth) in the last two (or three/five) years' for year 2015 - not at district level (found 5 unique locations)
Skipping indicator 'Number of women with a live birth (or stillbirth) in the last two (or three/five) years' for year 2017 - not at district level (found 5 unique locations)
Skipping indicator 'Number of women with a live birth (or stillbirth) in the last two (or three/five) years' for year 2019 - not at district level (found 5 unique locations)
Skipping indicator 'Number of women with a live birth (or stillbirth) in the last two (or three/five) years (unweighted)' for year 2005 - not at district level (found 5 unique locations)
Skipping indicator 'Number of women with a live birth (or stillbirth) in the last two (or three/five) years (unweighted)' for year 2008 - not at district level (found 5 unique locations)
Skipping indicator 'Number of women with a live birth (or stillbirth) in the last two (or three/five) years (unweighted)' for year 2010 - not at district level (found 5 unique locations)
Skipping indicator 'Number of women with a live birth (or stillbirth) in the last two (or three/five) years (unweighted)' for year 2013 - not at district level (found 5 unique locations)
Skipping indicator 'Number of women with a live birth (or stillbirth) in the last two (or three/five) years (unweighted)' for year 2015 - not at district level (found 5 unique locations)
Skipping indicator 'Number of women with a live birth (or stillbirth) in the last two (or three/five) years (unweighted)' for year 2017 - not at district level (found 5 unique locations)
Skipping indicator 'Number of women with a live birth (or stillbirth) in the last two (or three/five) years (unweighted)' for year 2019 - not at district level (found 5 unique locations)
Skipping indicator 'Place of delivery: At home' for year 2005 - not at district level (found 5 unique locations)
Skipping indicator 'Place of delivery: At home' for year 2008 - not at district level (found 5 unique locations)
Skipping indicator 'Place of delivery: At home' for year 2010 - not at district level (found 5 unique locations)
Skipping indicator 'Place of delivery: At home' for year 2015 - not at district level (found 5 unique locations)
Skipping indicator 'Place of delivery: At home' for year 2019 - not at district level (found 5 unique locations)
Skipping indicator 'Place of delivery: Health facility' for year 2005 - not at district level (found 5 unique locations)
Skipping indicator 'Place of delivery: Health facility' for year 2008 - not at district level (found 5 unique locations)
Skipping indicator 'Place of delivery: Health facility' for year 2010 - not at district level (found 5 unique locations)
Skipping indicator 'Place of delivery: Health facility' for year 2015 - not at district level (found 5 unique locations)
Skipping indicator 'Place of delivery: Health facility' for year 2019 - not at district level (found 5 unique locations)
Skipping indicator 'Place of delivery: Other' for year 2005 - not at district level (found 5 unique locations)
Skipping indicator 'Place of delivery: Other' for year 2008 - not at district level (found 5 unique locations)
Skipping indicator 'Place of delivery: Other' for year 2010 - not at district level (found 5 unique locations)
Skipping indicator 'Place of delivery: Other' for year 2015 - not at district level (found 5 unique locations)
Skipping indicator 'Place of delivery: Other' for year 2019 - not at district level (found 5 unique locations)
Skipping indicator 'Place of delivery: Private sector' for year 2005 - not at district level (found 5 unique locations)
Skipping indicator 'Place of delivery: Private sector' for year 2008 - not at district level (found 5 unique locations)
Skipping indicator 'Place of delivery: Private sector' for year 2010 - not at district level (found 5 unique locations)
Skipping indicator 'Place of delivery: Private sector' for year 2015 - not at district level (found 5 unique locations)
Skipping indicator 'Place of delivery: Private sector' for year 2019 - not at district level (found 5 unique locations)
Skipping indicator 'Place of delivery: Public sector' for year 2005 - not at district level (found 5 unique locations)
Skipping indicator 'Place of delivery: Public sector' for year 2008 - not at district level (found 5 unique locations)
Skipping indicator 'Place of delivery: Public sector' for year 2010 - not at district level (found 5 unique locations)
Skipping indicator 'Place of delivery: Public sector' for year 2015 - not at district level (found 5 unique locations)
Skipping indicator 'Place of delivery: Public sector' for year 2019 - not at district level (found 5 unique locations)
Skipping indicator 'Place of delivery: Total' for year 2005 - not at district level (found 5 unique locations)
Skipping indicator 'Place of delivery: Total' for year 2008 - not at district level (found 5 unique locations)
Skipping indicator 'Place of delivery: Total' for year 2010 - not at district level (found 5 unique locations)
Skipping indicator 'Place of delivery: Total' for year 2015 - not at district level (found 5 unique locations)
Skipping indicator 'Place of delivery: Total' for year 2019 - not at district level (found 5 unique locations)
Skipping indicator 'Place of delivery: don't know or missing' for year 2005 - not at district level (found 5 unique locations)
Skipping indicator 'Place of delivery: don't know or missing' for year 2008 - not at district level (found 5 unique locations)
Skipping indicator 'Place of delivery: don't know or missing' for year 2010 - not at district level (found 5 unique locations)
Skipping indicator 'Place of delivery: don't know or missing' for year 2015 - not at district level (found 5 unique locations)
Skipping indicator 'Provider of mothers' first postnatal checkup: Auxiliary nurse/midwife' for year 2010 - not at district level (found 5 unique locations)
Skipping indicator 'Provider of mothers' first postnatal checkup: Auxiliary nurse/midwife' for year 2015 - not at district level (found 5 unique locations)
Skipping indicator 'Provider of mothers' first postnatal checkup: Auxiliary nurse/midwife' for year 2019 - not at district level (found 5 unique locations)
Skipping indicator 'Provider of mothers' first postnatal checkup: Community health worker' for year 2015 - not at district level (found 5 unique locations)
Skipping indicator 'Provider of mothers' first postnatal checkup: Community health worker' for year 2019 - not at district level (found 5 unique locations)
Skipping indicator 'Provider of mothers' first postnatal checkup: Doctor/nurse/midwife' for year 2010 - not at district level (found 5 unique locations)
Skipping indicator 'Provider of mothers' first postnatal checkup: Doctor/nurse/midwife' for year 2015 - not at district level (found 5 unique locations)
Skipping indicator 'Provider of mothers' first postnatal checkup: Doctor/nurse/midwife' for year 2019 - not at district level (found 5 unique locations)
Skipping indicator 'Provider of mothers' first postnatal checkup: Other health worker' for year 2015 - not at district level (found 5 unique locations)
Skipping indicator 'Provider of mothers' first postnatal checkup: Total' for year 2010 - not at district level (found 5 unique locations)
Skipping indicator 'Provider of mothers' first postnatal checkup: Total' for year 2015 - not at district level (found 5 unique locations)
Skipping indicator 'Provider of mothers' first postnatal checkup: Total' for year 2019 - not at district level (found 5 unique locations)
Skipping indicator 'Provider of newborns' first postnatal checkup: Auxiliary nurse/midwife' for year 2010 - not at district level (found 5 unique locations)
Skipping indicator 'Provider of newborns' first postnatal checkup: Auxiliary nurse/midwife' for year 2015 - not at district level (found 5 unique locations)
Skipping indicator 'Provider of newborns' first postnatal checkup: Auxiliary nurse/midwife' for year 2019 - not at district level (found 5 unique locations)
Skipping indicator 'Provider of newborns' first postnatal checkup: Community health worker' for year 2015 - not at district level (found 5 unique locations)
Skipping indicator 'Provider of newborns' first postnatal checkup: Community health worker' for year 2019 - not at district level (found 5 unique locations)
Skipping indicator 'Provider of newborns' first postnatal checkup: Doctor/nurse/midwife' for year 2010 - not at district level (found 5 unique locations)
Skipping indicator 'Provider of newborns' first postnatal checkup: Doctor/nurse/midwife' for year 2015 - not at district level (found 5 unique locations)
Skipping indicator 'Provider of newborns' first postnatal checkup: Doctor/nurse/midwife' for year 2019 - not at district level (found 5 unique locations)
Skipping indicator 'Provider of newborns' first postnatal checkup: Other health worker' for year 2015 - not at district level (found 5 unique locations)
Skipping indicator 'Provider of newborns' first postnatal checkup: Total' for year 2010 - not at district level (found 5 unique locations)
Skipping indicator 'Provider of newborns' first postnatal checkup: Total' for year 2015 - not at district level (found 5 unique locations)
Skipping indicator 'Provider of newborns' first postnatal checkup: Total' for year 2019 - not at district level (found 5 unique locations)
Skipping indicator 'Provider of newborns' first postnatal checkup: Traditional birth attendant' for year 2015 - not at district level (found 5 unique locations)
Skipping indicator 'Provider of newborns' first postnatal checkup: Traditional birth attendant' for year 2019 - not at district level (found 5 unique locations)
Skipping indicator 'Treatment of diarrhea: Advice or treatment was sought' for year 2005 - not at district level (found 5 unique locations)
Skipping indicator 'Treatment of diarrhea: Advice or treatment was sought' for year 2008 - not at district level (found 5 unique locations)
Skipping indicator 'Treatment of diarrhea: Advice or treatment was sought' for year 2010 - not at district level (found 5 unique locations)
Skipping indicator 'Treatment of diarrhea: Advice or treatment was sought' for year 2015 - not at district level (found 5 unique locations)
Skipping indicator 'Treatment of diarrhea: Advice or treatment was sought' for year 2019 - not at district level (found 5 unique locations)
Skipping indicator 'Treatment of diarrhea: Antibiotics' for year 2008 - not at district level (found 5 unique locations)
Skipping indicator 'Treatment of diarrhea: Antibiotics' for year 2010 - not at district level (found 5 unique locations)
Skipping indicator 'Treatment of diarrhea: Antibiotics' for year 2015 - not at district level (found 5 unique locations)
Skipping indicator 'Treatment of diarrhea: Antibiotics' for year 2019 - not at district level (found 5 unique locations)
Skipping indicator 'Treatment of diarrhea: Antimotility drugs' for year 2008 - not at district level (found 5 unique locations)
Skipping indicator 'Treatment of diarrhea: Antimotility drugs' for year 2010 - not at district level (found 5 unique locations)
Skipping indicator 'Treatment of diarrhea: Antimotility drugs' for year 2015 - not at district level (found 5 unique locations)
Skipping indicator 'Treatment of diarrhea: Antimotility drugs' for year 2019 - not at district level (found 5 unique locations)
Skipping indicator 'Treatment of diarrhea: Either ORS or RHF' for year 2005 - not at district level (found 5 unique locations)
Skipping indicator 'Treatment of diarrhea: Either ORS or RHF' for year 2008 - not at district level (found 5 unique locations)
Skipping indicator 'Treatment of diarrhea: Either ORS or RHF' for year 2010 - not at district level (found 5 unique locations)
Skipping indicator 'Treatment of diarrhea: Either ORS or RHF' for year 2015 - not at district level (found 5 unique locations)
Skipping indicator 'Treatment of diarrhea: Either ORS or RHF' for year 2019 - not at district level (found 5 unique locations)
Skipping indicator 'Treatment of diarrhea: Home remedy - other' for year 2005 - not at district level (found 5 unique locations)
Skipping indicator 'Treatment of diarrhea: Home remedy - other' for year 2008 - not at district level (found 5 unique locations)
Skipping indicator 'Treatment of diarrhea: Home remedy - other' for year 2010 - not at district level (found 5 unique locations)
Skipping indicator 'Treatment of diarrhea: Home remedy - other' for year 2015 - not at district level (found 5 unique locations)
Skipping indicator 'Treatment of diarrhea: Home remedy - other' for year 2019 - not at district level (found 5 unique locations)
Skipping indicator 'Treatment of diarrhea: Increased fluids' for year 2005 - not at district level (found 5 unique locations)
Skipping indicator 'Treatment of diarrhea: Increased fluids' for year 2008 - not at district level (found 5 unique locations)
Skipping indicator 'Treatment of diarrhea: Increased fluids' for year 2010 - not at district level (found 5 unique locations)
Skipping indicator 'Treatment of diarrhea: Increased fluids' for year 2015 - not at district level (found 5 unique locations)
Skipping indicator 'Treatment of diarrhea: Increased fluids' for year 2019 - not at district level (found 5 unique locations)
Skipping indicator 'Treatment of diarrhea: Injection' for year 2008 - not at district level (found 5 unique locations)
Skipping indicator 'Treatment of diarrhea: Injection' for year 2010 - not at district level (found 5 unique locations)
Skipping indicator 'Treatment of diarrhea: Injection' for year 2015 - not at district level (found 5 unique locations)
Skipping indicator 'Treatment of diarrhea: Injection' for year 2019 - not at district level (found 5 unique locations)
Skipping indicator 'Treatment of diarrhea: Intravenous solution' for year 2008 - not at district level (found 5 unique locations)
Skipping indicator 'Treatment of diarrhea: Intravenous solution' for year 2010 - not at district level (found 5 unique locations)
Skipping indicator 'Treatment of diarrhea: Intravenous solution' for year 2015 - not at district level (found 5 unique locations)
Skipping indicator 'Treatment of diarrhea: Intravenous solution' for year 2019 - not at district level (found 5 unique locations)
Skipping indicator 'Treatment of diarrhea: No ORS, RHF or increased fluids' for year 2005 - not at district level (found 5 unique locations)
Skipping indicator 'Treatment of diarrhea: No ORS, RHF or increased fluids' for year 2008 - not at district level (found 5 unique locations)
Skipping indicator 'Treatment of diarrhea: No ORS, RHF or increased fluids' for year 2010 - not at district level (found 5 unique locations)
Skipping indicator 'Treatment of diarrhea: No ORS, RHF or increased fluids' for year 2015 - not at district level (found 5 unique locations)
Skipping indicator 'Treatment of diarrhea: No ORS, RHF or increased fluids' for year 2019 - not at district level (found 5 unique locations)
Skipping indicator 'Treatment of diarrhea: No treatment' for year 2005 - not at district level (found 5 unique locations)
Skipping indicator 'Treatment of diarrhea: No treatment' for year 2008 - not at district level (found 5 unique locations)
Skipping indicator 'Treatment of diarrhea: No treatment' for year 2010 - not at district level (found 5 unique locations)
Skipping indicator 'Treatment of diarrhea: No treatment' for year 2015 - not at district level (found 5 unique locations)
Skipping indicator 'Treatment of diarrhea: No treatment' for year 2019 - not at district level (found 5 unique locations)
Skipping indicator 'Treatment of diarrhea: ORT or increased fluids' for year 2005 - not at district level (found 5 unique locations)
Skipping indicator 'Treatment of diarrhea: ORT or increased fluids' for year 2008 - not at district level (found 5 unique locations)
Skipping indicator 'Treatment of diarrhea: ORT or increased fluids' for year 2010 - not at district level (found 5 unique locations)
Skipping indicator 'Treatment of diarrhea: ORT or increased fluids' for year 2015 - not at district level (found 5 unique locations)
Skipping indicator 'Treatment of diarrhea: ORT or increased fluids' for year 2019 - not at district level (found 5 unique locations)
Skipping indicator 'Treatment of diarrhea: Oral rehydration solution (ORS)' for year 2005 - not at district level (found 5 unique locations)
Skipping indicator 'Treatment of diarrhea: Oral rehydration solution (ORS)' for year 2008 - not at district level (found 5 unique locations)
Skipping indicator 'Treatment of diarrhea: Oral rehydration solution (ORS)' for year 2010 - not at district level (found 5 unique locations)
Skipping indicator 'Treatment of diarrhea: Oral rehydration solution (ORS)' for year 2015 - not at district level (found 5 unique locations)
Skipping indicator 'Treatment of diarrhea: Oral rehydration solution (ORS)' for year 2019 - not at district level (found 5 unique locations)
Skipping indicator 'Treatment of diarrhea: Recommended home fluids (RHF) at home' for year 2005 - not at district level (found 5 unique locations)
Skipping indicator 'Treatment of diarrhea: Recommended home fluids (RHF) at home' for year 2008 - not at district level (found 5 unique locations)
Skipping indicator 'Treatment of diarrhea: Recommended home fluids (RHF) at home' for year 2010 - not at district level (found 5 unique locations)
Skipping indicator 'Treatment of diarrhea: Recommended home fluids (RHF) at home' for year 2015 - not at district level (found 5 unique locations)
Skipping indicator 'Treatment of diarrhea: Recommended home fluids (RHF) at home' for year 2019 - not at district level (found 5 unique locations)
Skipping indicator 'Treatment of diarrhea: Zinc supplements' for year 2008 - not at district level (found 5 unique locations)
Skipping indicator 'Treatment of diarrhea: Zinc supplements' for year 2019 - not at district level (found 5 unique locations)
Skipping indicator 'Treatment of diarrhea: don't know or missing' for year 2005 - not at district level (found 5 unique locations)
Skipping indicator 'Treatment of diarrhea: don't know or missing' for year 2008 - not at district level (found 5 unique locations)
Skipping indicator 'Treatment of diarrhea: don't know or missing' for year 2010 - not at district level (found 5 unique locations)
Skipping indicator 'Treatment of diarrhea: don't know or missing' for year 2015 - not at district level (found 5 unique locations)
Skipping indicator 'Child mortality rate' for year 2005 - not at district level (found 5 unique locations)
Skipping indicator 'Child mortality rate' for year 2008 - not at district level (found 5 unique locations)
Skipping indicator 'Child mortality rate' for year 2010 - not at district level (found 5 unique locations)
Skipping indicator 'Child mortality rate' for year 2015 - not at district level (found 5 unique locations)
Skipping indicator 'Child mortality rate' for year 2019 - not at district level (found 5 unique locations)
Skipping indicator 'Early neonatal deaths' for year 2005 - not at district level (found 5 unique locations)
Skipping indicator 'Early neonatal deaths' for year 2010 - not at district level (found 5 unique locations)
Skipping indicator 'Early neonatal deaths' for year 2015 - not at district level (found 5 unique locations)
Skipping indicator 'Early neonatal deaths' for year 2019 - not at district level (found 5 unique locations)
Skipping indicator 'Infant mortality rate' for year 2005 - not at district level (found 5 unique locations)
Skipping indicator 'Infant mortality rate' for year 2008 - not at district level (found 5 unique locations)
Skipping indicator 'Infant mortality rate' for year 2010 - not at district level (found 5 unique locations)
Skipping indicator 'Infant mortality rate' for year 2015 - not at district level (found 5 unique locations)
Skipping indicator 'Infant mortality rate' for year 2019 - not at district level (found 5 unique locations)
Skipping indicator 'Neonatal mortality rate' for year 2005 - not at district level (found 5 unique locations)
Skipping indicator 'Neonatal mortality rate' for year 2008 - not at district level (found 5 unique locations)
Skipping indicator 'Neonatal mortality rate' for year 2010 - not at district level (found 5 unique locations)
Skipping indicator 'Neonatal mortality rate' for year 2015 - not at district level (found 5 unique locations)
Skipping indicator 'Neonatal mortality rate' for year 2019 - not at district level (found 5 unique locations)
Skipping indicator 'Number of pregnancies of 7+ months duration' for year 2005 - not at district level (found 5 unique locations)
Skipping indicator 'Number of pregnancies of 7+ months duration' for year 2010 - not at district level (found 5 unique locations)
Skipping indicator 'Number of pregnancies of 7+ months duration' for year 2015 - not at district level (found 5 unique locations)
Skipping indicator 'Number of pregnancies of 7+ months duration' for year 2019 - not at district level (found 5 unique locations)
Skipping indicator 'Number of pregnancies of 7+ months duration (unweighted)' for year 2005 - not at district level (found 5 unique locations)
Skipping indicator 'Number of pregnancies of 7+ months duration (unweighted)' for year 2010 - not at district level (found 5 unique locations)
Skipping indicator 'Number of pregnancies of 7+ months duration (unweighted)' for year 2015 - not at district level (found 5 unique locations)
Skipping indicator 'Number of pregnancies of 7+ months duration (unweighted)' for year 2019 - not at district level (found 5 unique locations)
Skipping indicator 'Perinatal mortality rate (5 years)' for year 2005 - not at district level (found 5 unique locations)
Skipping indicator 'Perinatal mortality rate (5 years)' for year 2010 - not at district level (found 5 unique locations)
Skipping indicator 'Perinatal mortality rate (5 years)' for year 2015 - not at district level (found 5 unique locations)
Skipping indicator 'Perinatal mortality rate (5 years)' for year 2019 - not at district level (found 5 unique locations)
Skipping indicator 'Postneonatal mortality rate' for year 2005 - not at district level (found 5 unique locations)
Skipping indicator 'Postneonatal mortality rate' for year 2008 - not at district level (found 5 unique locations)
Skipping indicator 'Postneonatal mortality rate' for year 2010 - not at district level (found 5 unique locations)
Skipping indicator 'Postneonatal mortality rate' for year 2015 - not at district level (found 5 unique locations)
Skipping indicator 'Postneonatal mortality rate' for year 2019 - not at district level (found 5 unique locations)
Skipping indicator 'Stillbirths' for year 2005 - not at district level (found 5 unique locations)
Skipping indicator 'Stillbirths' for year 2010 - not at district level (found 5 unique locations)
Skipping indicator 'Stillbirths' for year 2015 - not at district level (found 5 unique locations)
Skipping indicator 'Stillbirths' for year 2019 - not at district level (found 5 unique locations)
Skipping indicator 'Under-five mortality rate' for year 2005 - not at district level (found 5 unique locations)
Skipping indicator 'Under-five mortality rate' for year 2008 - not at district level (found 5 unique locations)
Skipping indicator 'Under-five mortality rate' for year 2010 - not at district level (found 5 unique locations)
Skipping indicator 'Under-five mortality rate' for year 2015 - not at district level (found 5 unique locations)
Skipping indicator 'Under-five mortality rate' for year 2019 - not at district level (found 5 unique locations)
Skipping indicator 'Households with one room for sleeping' for year 2010 - not at district level (found 5 unique locations)
Skipping indicator 'Households with one room for sleeping' for year 2013 - not at district level (found 5 unique locations)
Skipping indicator 'Households with one room for sleeping' for year 2015 - not at district level (found 5 unique locations)
Skipping indicator 'Households with one room for sleeping' for year 2017 - not at district level (found 5 unique locations)
Skipping indicator 'Households with one room for sleeping' for year 2019 - not at district level (found 5 unique locations)
Skipping indicator 'Mean number of household members' for year 2005 - not at district level (found 5 unique locations)
Skipping indicator 'Mean number of household members' for year 2008 - not at district level (found 5 unique locations)
Skipping indicator 'Mean number of household members' for year 2010 - not at district level (found 5 unique locations)
Skipping indicator 'Mean number of household members' for year 2013 - not at district level (found 5 unique locations)
Skipping indicator 'Mean number of household members' for year 2015 - not at district level (found 5 unique locations)
Skipping indicator 'Mean number of household members' for year 2017 - not at district level (found 5 unique locations)
Skipping indicator 'Mean number of household members' for year 2019 - not at district level (found 5 unique locations)
Skipping indicator 'Mean number of persons per sleeping room' for year 2010 - not at district level (found 5 unique locations)
Skipping indicator 'Mean number of persons per sleeping room' for year 2013 - not at district level (found 5 unique locations)
Skipping indicator 'Mean number of persons per sleeping room' for year 2015 - not at district level (found 5 unique locations)
Skipping indicator 'Mean number of persons per sleeping room' for year 2017 - not at district level (found 5 unique locations)
Skipping indicator 'Mean number of persons per sleeping room' for year 2019 - not at district level (found 5 unique locations)
Skipping indicator 'Population using a public tap/standpipe' for year 2005 - not at district level (found 5 unique locations)
Skipping indicator 'Population using a public tap/standpipe' for year 2008 - not at district level (found 5 unique locations)
Skipping indicator 'Population using a public tap/standpipe' for year 2010 - not at district level (found 5 unique locations)
Skipping indicator 'Population using a public tap/standpipe' for year 2013 - not at district level (found 5 unique locations)
Skipping indicator 'Population using a public tap/standpipe' for year 2015 - not at district level (found 5 unique locations)
Skipping indicator 'Population using a public tap/standpipe' for year 2017 - not at district level (found 5 unique locations)
Skipping indicator 'Population using a public tap/standpipe' for year 2019 - not at district level (found 5 unique locations)
Skipping indicator 'Population using an improved water source' for year 2005 - not at district level (found 5 unique locations)
Skipping indicator 'Population using an improved water source' for year 2008 - not at district level (found 5 unique locations)
Skipping indicator 'Population using an improved water source' for year 2010 - not at district level (found 5 unique locations)
Skipping indicator 'Population using an improved water source' for year 2013 - not at district level (found 5 unique locations)
Skipping indicator 'Population using an improved water source' for year 2015 - not at district level (found 5 unique locations)
Skipping indicator 'Population using an improved water source' for year 2017 - not at district level (found 5 unique locations)
Skipping indicator 'Population using an improved water source' for year 2019 - not at district level (found 5 unique locations)
Skipping indicator 'Population using open defecation' for year 2005 - not at district level (found 5 unique locations)
Skipping indicator 'Population using open defecation' for year 2008 - not at district level (found 5 unique locations)
Skipping indicator 'Population using open defecation' for year 2010 - not at district level (found 5 unique locations)
Skipping indicator 'Population using open defecation' for year 2013 - not at district level (found 5 unique locations)
Skipping indicator 'Population using open defecation' for year 2015 - not at district level (found 5 unique locations)
Skipping indicator 'Population using open defecation' for year 2017 - not at district level (found 5 unique locations)
Skipping indicator 'Population using open defecation' for year 2019 - not at district level (found 5 unique locations)
Skipping indicator 'Population using water piped into dwelling' for year 2005 - not at district level (found 5 unique locations)
Skipping indicator 'Population using water piped into dwelling' for year 2008 - not at district level (found 5 unique locations)
Skipping indicator 'Population using water piped into dwelling' for year 2010 - not at district level (found 5 unique locations)
Skipping indicator 'Population using water piped into dwelling' for year 2013 - not at district level (found 5 unique locations)
Skipping indicator 'Population using water piped into dwelling' for year 2015 - not at district level (found 5 unique locations)
Skipping indicator 'Population using water piped into dwelling' for year 2017 - not at district level (found 5 unique locations)
Skipping indicator 'Population using water piped into dwelling' for year 2019 - not at district level (found 5 unique locations)
Skipping indicator 'Population using water piped into yard/plot' for year 2005 - not at district level (found 5 unique locations)
Skipping indicator 'Population using water piped into yard/plot' for year 2008 - not at district level (found 5 unique locations)
Skipping indicator 'Population using water piped into yard/plot' for year 2010 - not at district level (found 5 unique locations)
Skipping indicator 'Population using water piped into yard/plot' for year 2013 - not at district level (found 5 unique locations)
Skipping indicator 'Population using water piped into yard/plot' for year 2015 - not at district level (found 5 unique locations)
Skipping indicator 'Population using water piped into yard/plot' for year 2017 - not at district level (found 5 unique locations)
Skipping indicator 'Population using water piped into yard/plot' for year 2019 - not at district level (found 5 unique locations)
Skipping indicator 'Population with a basic handwashing facility, with soap and water available' for year 2010 - not at district level (found 5 unique locations)
Skipping indicator 'Population with a basic handwashing facility, with soap and water available' for year 2015 - not at district level (found 5 unique locations)
Skipping indicator 'Population with a basic handwashing facility, with soap and water available' for year 2019 - not at district level (found 5 unique locations)
Skipping indicator 'Population with a limited handwashing facility, lacking soap and/or water' for year 2010 - not at district level (found 5 unique locations)
Skipping indicator 'Population with a limited handwashing facility, lacking soap and/or water' for year 2015 - not at district level (found 5 unique locations)
Skipping indicator 'Population with a limited handwashing facility, lacking soap and/or water' for year 2019 - not at district level (found 5 unique locations)
Skipping indicator 'Population with a place for handwashing was observed' for year 2010 - not at district level (found 5 unique locations)
Skipping indicator 'Population with a place for handwashing was observed' for year 2015 - not at district level (found 5 unique locations)
Skipping indicator 'Population with a place for handwashing was observed' for year 2019 - not at district level (found 5 unique locations)
Skipping indicator 'Population with an improved sanitation facility' for year 2005 - not at district level (found 5 unique locations)
Skipping indicator 'Population with an improved sanitation facility' for year 2008 - not at district level (found 5 unique locations)
Skipping indicator 'Population with an improved sanitation facility' for year 2010 - not at district level (found 5 unique locations)
Skipping indicator 'Population with an improved sanitation facility' for year 2013 - not at district level (found 5 unique locations)
Skipping indicator 'Population with an improved sanitation facility' for year 2015 - not at district level (found 5 unique locations)
Skipping indicator 'Population with an improved sanitation facility' for year 2017 - not at district level (found 5 unique locations)
Skipping indicator 'Population with an improved sanitation facility' for year 2019 - not at district level (found 5 unique locations)
Skipping indicator 'Population with an unimproved sanitation facility' for year 2005 - not at district level (found 5 unique locations)
Skipping indicator 'Population with an unimproved sanitation facility' for year 2008 - not at district level (found 5 unique locations)
Skipping indicator 'Population with an unimproved sanitation facility' for year 2010 - not at district level (found 5 unique locations)
Skipping indicator 'Population with an unimproved sanitation facility' for year 2013 - not at district level (found 5 unique locations)
Skipping indicator 'Population with an unimproved sanitation facility' for year 2015 - not at district level (found 5 unique locations)
Skipping indicator 'Population with an unimproved sanitation facility' for year 2017 - not at district level (found 5 unique locations)
Skipping indicator 'Population with an unimproved sanitation facility' for year 2019 - not at district level (found 5 unique locations)
Skipping indicator 'Population with basic sanitation service' for year 2005 - not at district level (found 5 unique locations)
Skipping indicator 'Population with basic sanitation service' for year 2008 - not at district level (found 5 unique locations)
Skipping indicator 'Population with basic sanitation service' for year 2010 - not at district level (found 5 unique locations)
Skipping indicator 'Population with basic sanitation service' for year 2013 - not at district level (found 5 unique locations)
Skipping indicator 'Population with basic sanitation service' for year 2015 - not at district level (found 5 unique locations)
Skipping indicator 'Population with basic sanitation service' for year 2017 - not at district level (found 5 unique locations)
Skipping indicator 'Population with basic sanitation service' for year 2019 - not at district level (found 5 unique locations)
Skipping indicator 'Population with basic water service' for year 2005 - not at district level (found 5 unique locations)
Skipping indicator 'Population with basic water service' for year 2008 - not at district level (found 5 unique locations)
Skipping indicator 'Population with basic water service' for year 2010 - not at district level (found 5 unique locations)
Skipping indicator 'Population with basic water service' for year 2013 - not at district level (found 5 unique locations)
Skipping indicator 'Population with basic water service' for year 2015 - not at district level (found 5 unique locations)
Skipping indicator 'Population with basic water service' for year 2017 - not at district level (found 5 unique locations)
Skipping indicator 'Population with basic water service' for year 2019 - not at district level (found 5 unique locations)
Skipping indicator 'Population with improved water source on the premises' for year 2005 - not at district level (found 5 unique locations)
Skipping indicator 'Population with improved water source on the premises' for year 2008 - not at district level (found 5 unique locations)
Skipping indicator 'Population with improved water source on the premises' for year 2010 - not at district level (found 5 unique locations)
Skipping indicator 'Population with improved water source on the premises' for year 2013 - not at district level (found 5 unique locations)
Skipping indicator 'Population with improved water source on the premises' for year 2015 - not at district level (found 5 unique locations)
Skipping indicator 'Population with improved water source on the premises' for year 2017 - not at district level (found 5 unique locations)
Skipping indicator 'Population with improved water source on the premises' for year 2019 - not at district level (found 5 unique locations)
Skipping indicator 'Population with limited sanitation service' for year 2005 - not at district level (found 5 unique locations)
Skipping indicator 'Population with limited sanitation service' for year 2008 - not at district level (found 5 unique locations)
Skipping indicator 'Population with limited sanitation service' for year 2010 - not at district level (found 5 unique locations)
Skipping indicator 'Population with limited sanitation service' for year 2013 - not at district level (found 5 unique locations)
Skipping indicator 'Population with limited sanitation service' for year 2015 - not at district level (found 5 unique locations)
Skipping indicator 'Population with limited sanitation service' for year 2017 - not at district level (found 5 unique locations)
Skipping indicator 'Population with limited sanitation service' for year 2019 - not at district level (found 5 unique locations)
Skipping indicator 'Population with limited water service' for year 2005 - not at district level (found 5 unique locations)
Skipping indicator 'Population with limited water service' for year 2008 - not at district level (found 5 unique locations)
Skipping indicator 'Population with limited water service' for year 2010 - not at district level (found 5 unique locations)
Skipping indicator 'Population with limited water service' for year 2013 - not at district level (found 5 unique locations)
Skipping indicator 'Population with limited water service' for year 2015 - not at district level (found 5 unique locations)
Skipping indicator 'Population with limited water service' for year 2017 - not at district level (found 5 unique locations)
Skipping indicator 'Population with limited water service' for year 2019 - not at district level (found 5 unique locations)
Skipping indicator 'Population with water more than 30 minutes away round trip' for year 2005 - not at district level (found 5 unique locations)
Skipping indicator 'Population with water more than 30 minutes away round trip' for year 2008 - not at district level (found 5 unique locations)
Skipping indicator 'Population with water more than 30 minutes away round trip' for year 2010 - not at district level (found 5 unique locations)
Skipping indicator 'Population with water more than 30 minutes away round trip' for year 2013 - not at district level (found 5 unique locations)
Skipping indicator 'Population with water more than 30 minutes away round trip' for year 2015 - not at district level (found 5 unique locations)
Skipping indicator 'Population with water more than 30 minutes away round trip' for year 2017 - not at district level (found 5 unique locations)
Skipping indicator 'Population with water more than 30 minutes away round trip' for year 2019 - not at district level (found 5 unique locations)
Skipping indicator 'Children stunted' for year 2005 - not at district level (found 5 unique locations)
Skipping indicator 'Children stunted' for year 2010 - not at district level (found 5 unique locations)
Skipping indicator 'Children stunted' for year 2015 - not at district level (found 5 unique locations)
Skipping indicator 'Children stunted' for year 2019 - not at district level (found 5 unique locations)
Skipping indicator 'Children under 5 who slept under an insecticide-treated net (ITN)' for year 2005 - not at district level (found 5 unique locations)
Skipping indicator 'Children under 5 who slept under an insecticide-treated net (ITN)' for year 2008 - not at district level (found 5 unique locations)
Skipping indicator 'Children under 5 who slept under an insecticide-treated net (ITN)' for year 2010 - not at district level (found 5 unique locations)
Skipping indicator 'Children under 5 who slept under an insecticide-treated net (ITN)' for year 2013 - not at district level (found 5 unique locations)
Skipping indicator 'Children under 5 who slept under an insecticide-treated net (ITN)' for year 2015 - not at district level (found 5 unique locations)
Skipping indicator 'Children under 5 who slept under an insecticide-treated net (ITN)' for year 2017 - not at district level (found 5 unique locations)
Skipping indicator 'Children under 5 who slept under an insecticide-treated net (ITN)' for year 2019 - not at district level (found 5 unique locations)
Skipping indicator 'Children underweight' for year 2005 - not at district level (found 5 unique locations)
Skipping indicator 'Children underweight' for year 2010 - not at district level (found 5 unique locations)
Skipping indicator 'Children underweight' for year 2015 - not at district level (found 5 unique locations)
Skipping indicator 'Children underweight' for year 2019 - not at district level (found 5 unique locations)
Skipping indicator 'Children wasted' for year 2005 - not at district level (found 5 unique locations)
Skipping indicator 'Children wasted' for year 2010 - not at district level (found 5 unique locations)
Skipping indicator 'Children wasted' for year 2015 - not at district level (found 5 unique locations)
Skipping indicator 'Children wasted' for year 2019 - not at district level (found 5 unique locations)
Skipping indicator 'Demand for family planning satisfied by modern methods' for year 2005 - not at district level (found 5 unique locations)
Skipping indicator 'Demand for family planning satisfied by modern methods' for year 2008 - not at district level (found 5 unique locations)
Skipping indicator 'Demand for family planning satisfied by modern methods' for year 2010 - not at district level (found 5 unique locations)
Skipping indicator 'Demand for family planning satisfied by modern methods' for year 2015 - not at district level (found 5 unique locations)
Skipping indicator 'Demand for family planning satisfied by modern methods' for year 2019 - not at district level (found 5 unique locations)
Skipping indicator 'Fully vaccinated (8 basic antigens)' for year 2005 - not at district level (found 5 unique locations)
Skipping indicator 'Fully vaccinated (8 basic antigens)' for year 2008 - not at district level (found 5 unique locations)
Skipping indicator 'Fully vaccinated (8 basic antigens)' for year 2010 - not at district level (found 5 unique locations)
Skipping indicator 'Fully vaccinated (8 basic antigens)' for year 2015 - not at district level (found 5 unique locations)
Skipping indicator 'Fully vaccinated (8 basic antigens)' for year 2019 - not at district level (found 5 unique locations)
Skipping indicator 'HIV prevalence among general population' for year 2005 - not at district level (found 5 unique locations)
Skipping indicator 'HIV prevalence among general population' for year 2010 - not at district level (found 5 unique locations)
Skipping indicator 'HIV prevalence among general population' for year 2015 - not at district level (found 5 unique locations)
Skipping indicator 'HIV prevalence among men' for year 2005 - not at district level (found 5 unique locations)
Skipping indicator 'HIV prevalence among men' for year 2010 - not at district level (found 5 unique locations)
Skipping indicator 'HIV prevalence among men' for year 2015 - not at district level (found 5 unique locations)
Skipping indicator 'HIV prevalence among women' for year 2005 - not at district level (found 5 unique locations)
Skipping indicator 'HIV prevalence among women' for year 2010 - not at district level (found 5 unique locations)
Skipping indicator 'HIV prevalence among women' for year 2015 - not at district level (found 5 unique locations)
Skipping indicator 'Households with electricity' for year 2005 - not at district level (found 5 unique locations)
Skipping indicator 'Households with electricity' for year 2008 - not at district level (found 5 unique locations)
Skipping indicator 'Households with electricity' for year 2010 - not at district level (found 5 unique locations)
Skipping indicator 'Households with electricity' for year 2013 - not at district level (found 5 unique locations)
Skipping indicator 'Households with electricity' for year 2015 - not at district level (found 5 unique locations)
Skipping indicator 'Households with electricity' for year 2017 - not at district level (found 5 unique locations)
Skipping indicator 'Households with electricity' for year 2019 - not at district level (found 5 unique locations)
Skipping indicator 'Infant mortality rate' for year 2005 - not at district level (found 5 unique locations)
Skipping indicator 'Infant mortality rate' for year 2008 - not at district level (found 5 unique locations)
Skipping indicator 'Infant mortality rate' for year 2010 - not at district level (found 5 unique locations)
Skipping indicator 'Infant mortality rate' for year 2015 - not at district level (found 5 unique locations)
Skipping indicator 'Infant mortality rate' for year 2019 - not at district level (found 5 unique locations)
Skipping indicator 'Married women currently using any method of contraception' for year 2005 - not at district level (found 5 unique locations)
Skipping indicator 'Married women currently using any method of contraception' for year 2008 - not at district level (found 5 unique locations)
Skipping indicator 'Married women currently using any method of contraception' for year 2010 - not at district level (found 5 unique locations)
Skipping indicator 'Married women currently using any method of contraception' for year 2015 - not at district level (found 5 unique locations)
Skipping indicator 'Married women currently using any method of contraception' for year 2019 - not at district level (found 5 unique locations)
Skipping indicator 'Married women currently using any modern method of contraception' for year 2005 - not at district level (found 5 unique locations)
Skipping indicator 'Married women currently using any modern method of contraception' for year 2008 - not at district level (found 5 unique locations)
Skipping indicator 'Married women currently using any modern method of contraception' for year 2010 - not at district level (found 5 unique locations)
Skipping indicator 'Married women currently using any modern method of contraception' for year 2015 - not at district level (found 5 unique locations)
Skipping indicator 'Married women currently using any modern method of contraception' for year 2019 - not at district level (found 5 unique locations)
Skipping indicator 'Median age at first marriage [Women]: 25-49' for year 2005 - not at district level (found 5 unique locations)
Skipping indicator 'Median age at first marriage [Women]: 25-49' for year 2010 - not at district level (found 5 unique locations)
Skipping indicator 'Median age at first marriage [Women]: 25-49' for year 2015 - not at district level (found 5 unique locations)
Skipping indicator 'Median age at first marriage [Women]: 25-49' for year 2019 - not at district level (found 5 unique locations)
Skipping indicator 'Median age at first sexual intercourse [Women]: 25-49' for year 2005 - not at district level (found 5 unique locations)
Skipping indicator 'Median age at first sexual intercourse [Women]: 25-49' for year 2010 - not at district level (found 5 unique locations)
Skipping indicator 'Median age at first sexual intercourse [Women]: 25-49' for year 2015 - not at district level (found 5 unique locations)
Skipping indicator 'Median age at first sexual intercourse [Women]: 25-49' for year 2019 - not at district level (found 5 unique locations)
Skipping indicator 'Median duration of exclusive breastfeeding' for year 2005 - not at district level (found 5 unique locations)
Skipping indicator 'Median duration of exclusive breastfeeding' for year 2010 - not at district level (found 5 unique locations)
Skipping indicator 'Median duration of exclusive breastfeeding' for year 2015 - not at district level (found 5 unique locations)
Skipping indicator 'Median duration of exclusive breastfeeding' for year 2019 - not at district level (found 5 unique locations)
Skipping indicator 'Men receiving an HIV test and receiving test results in the last 12 months' for year 2005 - not at district level (found 5 unique locations)
Skipping indicator 'Men receiving an HIV test and receiving test results in the last 12 months' for year 2010 - not at district level (found 5 unique locations)
Skipping indicator 'Men receiving an HIV test and receiving test results in the last 12 months' for year 2015 - not at district level (found 5 unique locations)
Skipping indicator 'Men receiving an HIV test and receiving test results in the last 12 months' for year 2019 - not at district level (found 5 unique locations)
Skipping indicator 'Physical or sexual violence committed by husband/partner' for year 2005 - not at district level (found 5 unique locations)
Skipping indicator 'Physical or sexual violence committed by husband/partner' for year 2010 - not at district level (found 5 unique locations)
Skipping indicator 'Physical or sexual violence committed by husband/partner' for year 2015 - not at district level (found 5 unique locations)
Skipping indicator 'Physical or sexual violence committed by husband/partner' for year 2019 - not at district level (found 5 unique locations)
Skipping indicator 'Place of delivery: Health facility' for year 2005 - not at district level (found 5 unique locations)
Skipping indicator 'Place of delivery: Health facility' for year 2008 - not at district level (found 5 unique locations)
Skipping indicator 'Place of delivery: Health facility' for year 2010 - not at district level (found 5 unique locations)
Skipping indicator 'Place of delivery: Health facility' for year 2015 - not at district level (found 5 unique locations)
Skipping indicator 'Place of delivery: Health facility' for year 2019 - not at district level (found 5 unique locations)
Skipping indicator 'Total fertility rate 15-49' for year 2005 - not at district level (found 5 unique locations)
Skipping indicator 'Total fertility rate 15-49' for year 2008 - not at district level (found 5 unique locations)
Skipping indicator 'Total fertility rate 15-49' for year 2010 - not at district level (found 5 unique locations)
Skipping indicator 'Total fertility rate 15-49' for year 2013 - not at district level (found 5 unique locations)
Skipping indicator 'Total fertility rate 15-49' for year 2015 - not at district level (found 5 unique locations)
Skipping indicator 'Total fertility rate 15-49' for year 2017 - not at district level (found 5 unique locations)
Skipping indicator 'Total fertility rate 15-49' for year 2019 - not at district level (found 5 unique locations)
Skipping indicator 'Treatment of diarrhea: Either ORS or RHF' for year 2005 - not at district level (found 5 unique locations)
Skipping indicator 'Treatment of diarrhea: Either ORS or RHF' for year 2008 - not at district level (found 5 unique locations)
Skipping indicator 'Treatment of diarrhea: Either ORS or RHF' for year 2010 - not at district level (found 5 unique locations)
Skipping indicator 'Treatment of diarrhea: Either ORS or RHF' for year 2015 - not at district level (found 5 unique locations)
Skipping indicator 'Treatment of diarrhea: Either ORS or RHF' for year 2019 - not at district level (found 5 unique locations)
Skipping indicator 'Under-five mortality rate' for year 2005 - not at district level (found 5 unique locations)
Skipping indicator 'Under-five mortality rate' for year 2008 - not at district level (found 5 unique locations)
Skipping indicator 'Under-five mortality rate' for year 2010 - not at district level (found 5 unique locations)
Skipping indicator 'Under-five mortality rate' for year 2015 - not at district level (found 5 unique locations)
Skipping indicator 'Under-five mortality rate' for year 2019 - not at district level (found 5 unique locations)
Skipping indicator 'Unmet need for family planning' for year 2005 - not at district level (found 5 unique locations)
Skipping indicator 'Unmet need for family planning' for year 2008 - not at district level (found 5 unique locations)
Skipping indicator 'Unmet need for family planning' for year 2010 - not at district level (found 5 unique locations)
Skipping indicator 'Unmet need for family planning' for year 2015 - not at district level (found 5 unique locations)
Skipping indicator 'Unmet need for family planning' for year 2019 - not at district level (found 5 unique locations)
Skipping indicator 'Women receiving an HIV test and receiving test results in the last 12 months' for year 2005 - not at district level (found 5 unique locations)
Skipping indicator 'Women receiving an HIV test and receiving test results in the last 12 months' for year 2010 - not at district level (found 5 unique locations)
Skipping indicator 'Women receiving an HIV test and receiving test results in the last 12 months' for year 2015 - not at district level (found 5 unique locations)
Skipping indicator 'Women receiving an HIV test and receiving test results in the last 12 months' for year 2019 - not at district level (found 5 unique locations)
Skipping indicator 'Women who are literate' for year 2005 - not at district level (found 5 unique locations)
Skipping indicator 'Women who are literate' for year 2010 - not at district level (found 5 unique locations)
Skipping indicator 'Women who are literate' for year 2013 - not at district level (found 5 unique locations)
Skipping indicator 'Women who are literate' for year 2015 - not at district level (found 5 unique locations)
Skipping indicator 'Women who are literate' for year 2017 - not at district level (found 5 unique locations)
Skipping indicator 'Women who are literate' for year 2019 - not at district level (found 5 unique locations)
Skipping indicator 'Women with secondary or higher education' for year 2005 - not at district level (found 5 unique locations)
Skipping indicator 'Women with secondary or higher education' for year 2008 - not at district level (found 5 unique locations)
Skipping indicator 'Women with secondary or higher education' for year 2010 - not at district level (found 5 unique locations)
Skipping indicator 'Women with secondary or higher education' for year 2013 - not at district level (found 5 unique locations)
Skipping indicator 'Women with secondary or higher education' for year 2015 - not at district level (found 5 unique locations)
Skipping indicator 'Women with secondary or higher education' for year 2017 - not at district level (found 5 unique locations)
Skipping indicator 'Women with secondary or higher education' for year 2019 - not at district level (found 5 unique locations)
Skipping indicator 'Age specific fertility rate: 15-19' for year 2005 - not at district level (found 5 unique locations)
Skipping indicator 'Age specific fertility rate: 15-19' for year 2008 - not at district level (found 5 unique locations)
Skipping indicator 'Age specific fertility rate: 15-19' for year 2010 - not at district level (found 5 unique locations)
Skipping indicator 'Age specific fertility rate: 15-19' for year 2013 - not at district level (found 5 unique locations)
Skipping indicator 'Age specific fertility rate: 15-19' for year 2015 - not at district level (found 5 unique locations)
Skipping indicator 'Age specific fertility rate: 15-19' for year 2017 - not at district level (found 5 unique locations)
Skipping indicator 'Age specific fertility rate: 15-19' for year 2019 - not at district level (found 5 unique locations)
Skipping indicator 'Age specific fertility rate: 20-24' for year 2005 - not at district level (found 5 unique locations)
Skipping indicator 'Age specific fertility rate: 20-24' for year 2008 - not at district level (found 5 unique locations)
Skipping indicator 'Age specific fertility rate: 20-24' for year 2010 - not at district level (found 5 unique locations)
Skipping indicator 'Age specific fertility rate: 20-24' for year 2013 - not at district level (found 5 unique locations)
Skipping indicator 'Age specific fertility rate: 20-24' for year 2015 - not at district level (found 5 unique locations)
Skipping indicator 'Age specific fertility rate: 20-24' for year 2017 - not at district level (found 5 unique locations)
Skipping indicator 'Age specific fertility rate: 20-24' for year 2019 - not at district level (found 5 unique locations)
Skipping indicator 'Age specific fertility rate: 25-29' for year 2005 - not at district level (found 5 unique locations)
Skipping indicator 'Age specific fertility rate: 25-29' for year 2008 - not at district level (found 5 unique locations)
Skipping indicator 'Age specific fertility rate: 25-29' for year 2010 - not at district level (found 5 unique locations)
Skipping indicator 'Age specific fertility rate: 25-29' for year 2013 - not at district level (found 5 unique locations)
Skipping indicator 'Age specific fertility rate: 25-29' for year 2015 - not at district level (found 5 unique locations)
Skipping indicator 'Age specific fertility rate: 25-29' for year 2017 - not at district level (found 5 unique locations)
Skipping indicator 'Age specific fertility rate: 25-29' for year 2019 - not at district level (found 5 unique locations)
Skipping indicator 'Age specific fertility rate: 30-34' for year 2005 - not at district level (found 5 unique locations)
Skipping indicator 'Age specific fertility rate: 30-34' for year 2008 - not at district level (found 5 unique locations)
Skipping indicator 'Age specific fertility rate: 30-34' for year 2010 - not at district level (found 5 unique locations)
Skipping indicator 'Age specific fertility rate: 30-34' for year 2013 - not at district level (found 5 unique locations)
Skipping indicator 'Age specific fertility rate: 30-34' for year 2015 - not at district level (found 5 unique locations)
Skipping indicator 'Age specific fertility rate: 30-34' for year 2017 - not at district level (found 5 unique locations)
Skipping indicator 'Age specific fertility rate: 30-34' for year 2019 - not at district level (found 5 unique locations)
Skipping indicator 'Age specific fertility rate: 35-39' for year 2005 - not at district level (found 5 unique locations)
Skipping indicator 'Age specific fertility rate: 35-39' for year 2008 - not at district level (found 5 unique locations)
Skipping indicator 'Age specific fertility rate: 35-39' for year 2010 - not at district level (found 5 unique locations)
Skipping indicator 'Age specific fertility rate: 35-39' for year 2013 - not at district level (found 5 unique locations)
Skipping indicator 'Age specific fertility rate: 35-39' for year 2015 - not at district level (found 5 unique locations)
Skipping indicator 'Age specific fertility rate: 35-39' for year 2017 - not at district level (found 5 unique locations)
Skipping indicator 'Age specific fertility rate: 35-39' for year 2019 - not at district level (found 5 unique locations)
Skipping indicator 'Age specific fertility rate: 40-44' for year 2005 - not at district level (found 5 unique locations)
Skipping indicator 'Age specific fertility rate: 40-44' for year 2008 - not at district level (found 5 unique locations)
Skipping indicator 'Age specific fertility rate: 40-44' for year 2010 - not at district level (found 5 unique locations)
Skipping indicator 'Age specific fertility rate: 40-44' for year 2013 - not at district level (found 5 unique locations)
Skipping indicator 'Age specific fertility rate: 40-44' for year 2015 - not at district level (found 5 unique locations)
Skipping indicator 'Age specific fertility rate: 40-44' for year 2017 - not at district level (found 5 unique locations)
Skipping indicator 'Age specific fertility rate: 40-44' for year 2019 - not at district level (found 5 unique locations)
Skipping indicator 'Age specific fertility rate: 45-49' for year 1992 - not at district level (found 3 unique locations)
Skipping indicator 'Age specific fertility rate: 45-49' for year 2005 - not at district level (found 4 unique locations)
Skipping indicator 'Age specific fertility rate: 45-49' for year 2008 - not at district level (found 4 unique locations)
Skipping indicator 'Age specific fertility rate: 45-49' for year 2010 - not at district level (found 5 unique locations)
Skipping indicator 'Age specific fertility rate: 45-49' for year 2013 - not at district level (found 3 unique locations)
Skipping indicator 'Age specific fertility rate: 45-49' for year 2015 - not at district level (found 5 unique locations)
Skipping indicator 'Age specific fertility rate: 45-49' for year 2017 - not at district level (found 4 unique locations)
Skipping indicator 'Age specific fertility rate: 45-49' for year 2019 - not at district level (found 5 unique locations)
Skipping indicator 'Crude birth rate' for year 2005 - not at district level (found 5 unique locations)
Skipping indicator 'Crude birth rate' for year 2008 - not at district level (found 5 unique locations)
Skipping indicator 'Crude birth rate' for year 2010 - not at district level (found 5 unique locations)
Skipping indicator 'Crude birth rate' for year 2013 - not at district level (found 5 unique locations)
Skipping indicator 'Crude birth rate' for year 2015 - not at district level (found 5 unique locations)
Skipping indicator 'Crude birth rate' for year 2017 - not at district level (found 5 unique locations)
Skipping indicator 'Crude birth rate' for year 2019 - not at district level (found 5 unique locations)
Skipping indicator 'General fertility rate' for year 2005 - not at district level (found 5 unique locations)
Skipping indicator 'General fertility rate' for year 2008 - not at district level (found 5 unique locations)
Skipping indicator 'General fertility rate' for year 2010 - not at district level (found 5 unique locations)
Skipping indicator 'General fertility rate' for year 2013 - not at district level (found 5 unique locations)
Skipping indicator 'General fertility rate' for year 2015 - not at district level (found 5 unique locations)
Skipping indicator 'General fertility rate' for year 2017 - not at district level (found 5 unique locations)
Skipping indicator 'General fertility rate' for year 2019 - not at district level (found 5 unique locations)
Skipping indicator 'Total fertility rate 15-44' for year 2005 - not at district level (found 5 unique locations)
Skipping indicator 'Total fertility rate 15-44' for year 2008 - not at district level (found 5 unique locations)
Skipping indicator 'Total fertility rate 15-44' for year 2010 - not at district level (found 5 unique locations)
Skipping indicator 'Total fertility rate 15-44' for year 2013 - not at district level (found 5 unique locations)
Skipping indicator 'Total fertility rate 15-44' for year 2015 - not at district level (found 5 unique locations)
Skipping indicator 'Total fertility rate 15-44' for year 2017 - not at district level (found 5 unique locations)
Skipping indicator 'Total fertility rate 15-44' for year 2019 - not at district level (found 5 unique locations)
Skipping indicator 'Total fertility rate 15-49' for year 2005 - not at district level (found 5 unique locations)
Skipping indicator 'Total fertility rate 15-49' for year 2008 - not at district level (found 5 unique locations)
Skipping indicator 'Total fertility rate 15-49' for year 2010 - not at district level (found 5 unique locations)
Skipping indicator 'Total fertility rate 15-49' for year 2013 - not at district level (found 5 unique locations)
Skipping indicator 'Total fertility rate 15-49' for year 2015 - not at district level (found 5 unique locations)
Skipping indicator 'Total fertility rate 15-49' for year 2017 - not at district level (found 5 unique locations)
Skipping indicator 'Total fertility rate 15-49' for year 2019 - not at district level (found 5 unique locations)
Skipping indicator 'Total wanted fertility rate' for year 2005 - not at district level (found 5 unique locations)
Skipping indicator 'Total wanted fertility rate' for year 2008 - not at district level (found 5 unique locations)
Skipping indicator 'Total wanted fertility rate' for year 2010 - not at district level (found 5 unique locations)
Skipping indicator 'Total wanted fertility rate' for year 2015 - not at district level (found 5 unique locations)
Skipping indicator 'Total wanted fertility rate' for year 2019 - not at district level (found 5 unique locations)
Skipping indicator 'Mutual health organzation or community-base health insurance [Men]' for year 2019 - not at district level (found 5 unique locations)
Skipping indicator 'Mutual health organzation or community-base health insurance [Women]' for year 2019 - not at district level (found 5 unique locations)
Skipping indicator 'No health insurance [Men]' for year 2019 - not at district level (found 5 unique locations)
Skipping indicator 'No health insurance [Women]' for year 2019 - not at district level (found 5 unique locations)
Skipping indicator 'Number of men' for year 2019 - not at district level (found 5 unique locations)
Skipping indicator 'Number of men (unweighted)' for year 2019 - not at district level (found 5 unique locations)
Skipping indicator 'Number of women' for year 2019 - not at district level (found 5 unique locations)
Skipping indicator 'Number of women (unweighted)' for year 2019 - not at district level (found 5 unique locations)
Skipping indicator 'Other employer-base health insurance [Men]' for year 2019 - not at district level (found 5 unique locations)
Skipping indicator 'Other employer-base health insurance [Women]' for year 2019 - not at district level (found 5 unique locations)
Skipping indicator 'Other health insurance [Men]' for year 2019 - not at district level (found 5 unique locations)
Skipping indicator 'Other health insurance [Women]' for year 2019 - not at district level (found 5 unique locations)
Skipping indicator 'Privately purchased commercial insurance [Men]' for year 2019 - not at district level (found 5 unique locations)
Skipping indicator 'Privately purchased commercial insurance [Women]' for year 2019 - not at district level (found 5 unique locations)
Skipping indicator 'Social security health insurance [Men]' for year 2019 - not at district level (found 5 unique locations)
Skipping indicator 'Social security health insurance [Women]' for year 2019 - not at district level (found 5 unique locations)
Skipping indicator 'BCG vaccination received' for year 2005 - not at district level (found 5 unique locations)
Skipping indicator 'BCG vaccination received' for year 2008 - not at district level (found 5 unique locations)
Skipping indicator 'BCG vaccination received' for year 2010 - not at district level (found 5 unique locations)
Skipping indicator 'BCG vaccination received' for year 2015 - not at district level (found 5 unique locations)
Skipping indicator 'BCG vaccination received' for year 2019 - not at district level (found 5 unique locations)
Skipping indicator 'DPT 1 vaccination received' for year 2005 - not at district level (found 5 unique locations)
Skipping indicator 'DPT 1 vaccination received' for year 2008 - not at district level (found 5 unique locations)
Skipping indicator 'DPT 1 vaccination received' for year 2010 - not at district level (found 5 unique locations)
Skipping indicator 'DPT 1 vaccination received' for year 2015 - not at district level (found 5 unique locations)
Skipping indicator 'DPT 1 vaccination received' for year 2019 - not at district level (found 5 unique locations)
Skipping indicator 'DPT 2 vaccination received' for year 2005 - not at district level (found 5 unique locations)
Skipping indicator 'DPT 2 vaccination received' for year 2008 - not at district level (found 5 unique locations)
Skipping indicator 'DPT 2 vaccination received' for year 2010 - not at district level (found 5 unique locations)
Skipping indicator 'DPT 2 vaccination received' for year 2015 - not at district level (found 5 unique locations)
Skipping indicator 'DPT 2 vaccination received' for year 2019 - not at district level (found 5 unique locations)
Skipping indicator 'DPT 3 vaccination received' for year 2005 - not at district level (found 5 unique locations)
Skipping indicator 'DPT 3 vaccination received' for year 2008 - not at district level (found 5 unique locations)
Skipping indicator 'DPT 3 vaccination received' for year 2010 - not at district level (found 5 unique locations)
Skipping indicator 'DPT 3 vaccination received' for year 2015 - not at district level (found 5 unique locations)
Skipping indicator 'DPT 3 vaccination received' for year 2019 - not at district level (found 5 unique locations)
Skipping indicator 'Fully vaccinated (8 basic antigens)' for year 2005 - not at district level (found 5 unique locations)
Skipping indicator 'Fully vaccinated (8 basic antigens)' for year 2008 - not at district level (found 5 unique locations)
Skipping indicator 'Fully vaccinated (8 basic antigens)' for year 2010 - not at district level (found 5 unique locations)
Skipping indicator 'Fully vaccinated (8 basic antigens)' for year 2015 - not at district level (found 5 unique locations)
Skipping indicator 'Fully vaccinated (8 basic antigens)' for year 2019 - not at district level (found 5 unique locations)
Skipping indicator 'Haemophilus influenza type b 1 vaccination received' for year 2019 - not at district level (found 5 unique locations)
Skipping indicator 'Haemophilus influenza type b 2 vaccination received' for year 2019 - not at district level (found 5 unique locations)
Skipping indicator 'Haemophilus influenza type b 3 vaccination received' for year 2019 - not at district level (found 5 unique locations)
Skipping indicator 'Hepatitis 1 vaccination received' for year 2019 - not at district level (found 5 unique locations)
Skipping indicator 'Hepatitis 2 vaccination received' for year 2019 - not at district level (found 5 unique locations)
Skipping indicator 'Hepatitis 3 vaccination received' for year 2019 - not at district level (found 5 unique locations)
Skipping indicator 'Measles vaccination received' for year 2005 - not at district level (found 5 unique locations)
Skipping indicator 'Measles vaccination received' for year 2008 - not at district level (found 5 unique locations)
Skipping indicator 'Measles vaccination received' for year 2010 - not at district level (found 5 unique locations)
Skipping indicator 'Measles vaccination received' for year 2015 - not at district level (found 5 unique locations)
Skipping indicator 'Measles vaccination received' for year 2019 - not at district level (found 5 unique locations)
Skipping indicator 'Number of children 12-23 months' for year 2005 - not at district level (found 5 unique locations)
Skipping indicator 'Number of children 12-23 months' for year 2008 - not at district level (found 5 unique locations)
Skipping indicator 'Number of children 12-23 months' for year 2010 - not at district level (found 5 unique locations)
Skipping indicator 'Number of children 12-23 months' for year 2015 - not at district level (found 5 unique locations)
Skipping indicator 'Number of children 12-23 months' for year 2019 - not at district level (found 5 unique locations)
Skipping indicator 'Number of children 12-23 months (unweighted)' for year 2005 - not at district level (found 5 unique locations)
Skipping indicator 'Number of children 12-23 months (unweighted)' for year 2008 - not at district level (found 5 unique locations)
Skipping indicator 'Number of children 12-23 months (unweighted)' for year 2010 - not at district level (found 5 unique locations)
Skipping indicator 'Number of children 12-23 months (unweighted)' for year 2015 - not at district level (found 5 unique locations)
Skipping indicator 'Number of children 12-23 months (unweighted)' for year 2019 - not at district level (found 5 unique locations)
Skipping indicator 'Polio 0 vaccination received' for year 2005 - not at district level (found 5 unique locations)
Skipping indicator 'Polio 0 vaccination received' for year 2008 - not at district level (found 5 unique locations)
Skipping indicator 'Polio 0 vaccination received' for year 2010 - not at district level (found 5 unique locations)
Skipping indicator 'Polio 0 vaccination received' for year 2015 - not at district level (found 5 unique locations)
Skipping indicator 'Polio 0 vaccination received' for year 2019 - not at district level (found 5 unique locations)
Skipping indicator 'Polio 1 vaccination received' for year 2005 - not at district level (found 5 unique locations)
Skipping indicator 'Polio 1 vaccination received' for year 2008 - not at district level (found 5 unique locations)
Skipping indicator 'Polio 1 vaccination received' for year 2010 - not at district level (found 5 unique locations)
Skipping indicator 'Polio 1 vaccination received' for year 2015 - not at district level (found 5 unique locations)
Skipping indicator 'Polio 1 vaccination received' for year 2019 - not at district level (found 5 unique locations)
Skipping indicator 'Polio 2 vaccination received' for year 2005 - not at district level (found 5 unique locations)
Skipping indicator 'Polio 2 vaccination received' for year 2008 - not at district level (found 5 unique locations)
Skipping indicator 'Polio 2 vaccination received' for year 2010 - not at district level (found 5 unique locations)
Skipping indicator 'Polio 2 vaccination received' for year 2015 - not at district level (found 5 unique locations)
Skipping indicator 'Polio 2 vaccination received' for year 2019 - not at district level (found 5 unique locations)
Skipping indicator 'Polio 3 vaccination received' for year 2005 - not at district level (found 5 unique locations)
Skipping indicator 'Polio 3 vaccination received' for year 2008 - not at district level (found 5 unique locations)
Skipping indicator 'Polio 3 vaccination received' for year 2010 - not at district level (found 5 unique locations)
Skipping indicator 'Polio 3 vaccination received' for year 2015 - not at district level (found 5 unique locations)
Skipping indicator 'Polio 3 vaccination received' for year 2019 - not at district level (found 5 unique locations)
Skipping indicator 'Received no vaccinations' for year 2005 - not at district level (found 5 unique locations)
Skipping indicator 'Received no vaccinations' for year 2008 - not at district level (found 5 unique locations)
Skipping indicator 'Received no vaccinations' for year 2010 - not at district level (found 5 unique locations)
Skipping indicator 'Received no vaccinations' for year 2015 - not at district level (found 5 unique locations)
Skipping indicator 'Received no vaccinations' for year 2019 - not at district level (found 5 unique locations)
Skipping indicator 'Family planning messages in newspapers or magazines [Men]' for year 2005 - not at district level (found 5 unique locations)
Skipping indicator 'Family planning messages in newspapers or magazines [Men]' for year 2010 - not at district level (found 5 unique locations)
Skipping indicator 'Family planning messages in newspapers or magazines [Men]' for year 2015 - not at district level (found 5 unique locations)
Skipping indicator 'Family planning messages in newspapers or magazines [Men]' for year 2019 - not at district level (found 5 unique locations)
Skipping indicator 'Family planning messages in none of these three media [Men]' for year 2005 - not at district level (found 5 unique locations)
Skipping indicator 'Family planning messages in none of these three media [Men]' for year 2010 - not at district level (found 5 unique locations)
Skipping indicator 'Family planning messages in none of these three media [Men]' for year 2015 - not at district level (found 5 unique locations)
Skipping indicator 'Family planning messages in none of these three media [Men]' for year 2019 - not at district level (found 5 unique locations)
Skipping indicator 'Family planning messages on television [Men]' for year 2005 - not at district level (found 5 unique locations)
Skipping indicator 'Family planning messages on television [Men]' for year 2010 - not at district level (found 5 unique locations)
Skipping indicator 'Family planning messages on television [Men]' for year 2015 - not at district level (found 5 unique locations)
Skipping indicator 'Family planning messages on television [Men]' for year 2019 - not at district level (found 5 unique locations)
Skipping indicator 'Family planning messages on the radio [Men]' for year 2005 - not at district level (found 5 unique locations)
Skipping indicator 'Family planning messages on the radio [Men]' for year 2010 - not at district level (found 5 unique locations)
Skipping indicator 'Family planning messages on the radio [Men]' for year 2015 - not at district level (found 5 unique locations)
Skipping indicator 'Family planning messages on the radio [Men]' for year 2019 - not at district level (found 5 unique locations)
Skipping indicator 'Knowledge of any method of contraception among married men' for year 2005 - not at district level (found 5 unique locations)
Skipping indicator 'Knowledge of any method of contraception among married men' for year 2008 - not at district level (found 5 unique locations)
Skipping indicator 'Knowledge of any method of contraception among married men' for year 2010 - not at district level (found 5 unique locations)
Skipping indicator 'Knowledge of any method of contraception among married men' for year 2015 - not at district level (found 5 unique locations)
Skipping indicator 'Knowledge of any method of contraception among married men' for year 2019 - not at district level (found 5 unique locations)
Skipping indicator 'Knowledge of any modern method of contraception amonth married men' for year 2005 - not at district level (found 5 unique locations)
Skipping indicator 'Knowledge of any modern method of contraception amonth married men' for year 2008 - not at district level (found 5 unique locations)
Skipping indicator 'Knowledge of any modern method of contraception amonth married men' for year 2010 - not at district level (found 5 unique locations)
Skipping indicator 'Knowledge of any modern method of contraception amonth married men' for year 2015 - not at district level (found 5 unique locations)
Skipping indicator 'Knowledge of any modern method of contraception amonth married men' for year 2019 - not at district level (found 5 unique locations)
Skipping indicator 'Median age at first marriage [Men]: 20-24' for year 1992 - not at district level (found 2 unique locations)
Skipping indicator 'Median age at first marriage [Men]: 25-29' for year 2005 - not at district level (found 3 unique locations)
Skipping indicator 'Median age at first marriage [Men]: 25-29' for year 2010 - not at district level (found 3 unique locations)
Skipping indicator 'Median age at first marriage [Men]: 25-29' for year 2015 - not at district level (found 1 unique locations)
Skipping indicator 'Median age at first marriage [Men]: 25-29' for year 2019 - not at district level (found 1 unique locations)
Skipping indicator 'Median age at first marriage [Men]: 25-49(54,59)' for year 2005 - not at district level (found 3 unique locations)
Skipping indicator 'Median age at first marriage [Men]: 25-49(54,59)' for year 2010 - not at district level (found 3 unique locations)
Skipping indicator 'Median age at first marriage [Men]: 25-49(54,59)' for year 2015 - not at district level (found 2 unique locations)
Skipping indicator 'Median age at first marriage [Men]: 25-49(54,59)' for year 2019 - not at district level (found 1 unique locations)
Skipping indicator 'Median age at first marriage [Men]: 30-34' for year 2005 - not at district level (found 4 unique locations)
Skipping indicator 'Median age at first marriage [Men]: 30-34' for year 2010 - not at district level (found 5 unique locations)
Skipping indicator 'Median age at first marriage [Men]: 30-34' for year 2015 - not at district level (found 5 unique locations)
Skipping indicator 'Median age at first marriage [Men]: 30-34' for year 2019 - not at district level (found 5 unique locations)
Skipping indicator 'Median age at first marriage [Men]: 35-39' for year 2005 - not at district level (found 5 unique locations)
Skipping indicator 'Median age at first marriage [Men]: 35-39' for year 2010 - not at district level (found 5 unique locations)
Skipping indicator 'Median age at first marriage [Men]: 35-39' for year 2015 - not at district level (found 5 unique locations)
Skipping indicator 'Median age at first marriage [Men]: 35-39' for year 2019 - not at district level (found 5 unique locations)
Skipping indicator 'Median age at first marriage [Men]: 40-44' for year 2005 - not at district level (found 5 unique locations)
Skipping indicator 'Median age at first marriage [Men]: 40-44' for year 2010 - not at district level (found 5 unique locations)
Skipping indicator 'Median age at first marriage [Men]: 40-44' for year 2015 - not at district level (found 5 unique locations)
Skipping indicator 'Median age at first marriage [Men]: 40-44' for year 2019 - not at district level (found 5 unique locations)
Skipping indicator 'Median age at first marriage [Men]: 45-49' for year 2005 - not at district level (found 5 unique locations)
Skipping indicator 'Median age at first marriage [Men]: 45-49' for year 2010 - not at district level (found 5 unique locations)
Skipping indicator 'Median age at first marriage [Men]: 45-49' for year 2015 - not at district level (found 5 unique locations)
Skipping indicator 'Median age at first marriage [Men]: 45-49' for year 2019 - not at district level (found 5 unique locations)
Skipping indicator 'Median age at first marriage [Men]: 50-54' for year 2005 - not at district level (found 5 unique locations)
Skipping indicator 'Median age at first marriage [Men]: 50-54' for year 2010 - not at district level (found 5 unique locations)
Skipping indicator 'Median age at first marriage [Men]: 50-54' for year 2015 - not at district level (found 5 unique locations)
Skipping indicator 'Median age at first marriage [Men]: 50-54' for year 2019 - not at district level (found 5 unique locations)
Skipping indicator 'Median age at first sexual intercourse [Men]: 20-49(54,59)' for year 2000 - not at district level (found 2 unique locations)
Skipping indicator 'Median age at first sexual intercourse [Men]: 25-29' for year 2005 - not at district level (found 5 unique locations)
Skipping indicator 'Median age at first sexual intercourse [Men]: 25-29' for year 2010 - not at district level (found 5 unique locations)
Skipping indicator 'Median age at first sexual intercourse [Men]: 25-29' for year 2015 - not at district level (found 5 unique locations)
Skipping indicator 'Median age at first sexual intercourse [Men]: 25-29' for year 2019 - not at district level (found 5 unique locations)
Skipping indicator 'Median age at first sexual intercourse [Men]: 25-49(54,59)' for year 2005 - not at district level (found 5 unique locations)
Skipping indicator 'Median age at first sexual intercourse [Men]: 25-49(54,59)' for year 2010 - not at district level (found 5 unique locations)
Skipping indicator 'Median age at first sexual intercourse [Men]: 25-49(54,59)' for year 2015 - not at district level (found 5 unique locations)
Skipping indicator 'Median age at first sexual intercourse [Men]: 25-49(54,59)' for year 2019 - not at district level (found 5 unique locations)
Skipping indicator 'Median age at first sexual intercourse [Men]: 30-34' for year 2005 - not at district level (found 5 unique locations)
Skipping indicator 'Median age at first sexual intercourse [Men]: 30-34' for year 2010 - not at district level (found 5 unique locations)
Skipping indicator 'Median age at first sexual intercourse [Men]: 30-34' for year 2015 - not at district level (found 5 unique locations)
Skipping indicator 'Median age at first sexual intercourse [Men]: 30-34' for year 2019 - not at district level (found 5 unique locations)
Skipping indicator 'Median age at first sexual intercourse [Men]: 35-39' for year 2005 - not at district level (found 5 unique locations)
Skipping indicator 'Median age at first sexual intercourse [Men]: 35-39' for year 2010 - not at district level (found 5 unique locations)
Skipping indicator 'Median age at first sexual intercourse [Men]: 35-39' for year 2015 - not at district level (found 5 unique locations)
Skipping indicator 'Median age at first sexual intercourse [Men]: 35-39' for year 2019 - not at district level (found 5 unique locations)
Skipping indicator 'Median age at first sexual intercourse [Men]: 40-44' for year 2005 - not at district level (found 5 unique locations)
Skipping indicator 'Median age at first sexual intercourse [Men]: 40-44' for year 2010 - not at district level (found 5 unique locations)
Skipping indicator 'Median age at first sexual intercourse [Men]: 40-44' for year 2015 - not at district level (found 5 unique locations)
Skipping indicator 'Median age at first sexual intercourse [Men]: 40-44' for year 2019 - not at district level (found 5 unique locations)
Skipping indicator 'Median age at first sexual intercourse [Men]: 45-49' for year 2005 - not at district level (found 5 unique locations)
Skipping indicator 'Median age at first sexual intercourse [Men]: 45-49' for year 2010 - not at district level (found 5 unique locations)
Skipping indicator 'Median age at first sexual intercourse [Men]: 45-49' for year 2015 - not at district level (found 5 unique locations)
Skipping indicator 'Median age at first sexual intercourse [Men]: 45-49' for year 2019 - not at district level (found 5 unique locations)
Skipping indicator 'Median age at first sexual intercourse [Men]: 50-54' for year 2005 - not at district level (found 5 unique locations)
Skipping indicator 'Median age at first sexual intercourse [Men]: 50-54' for year 2010 - not at district level (found 5 unique locations)
Skipping indicator 'Median age at first sexual intercourse [Men]: 50-54' for year 2015 - not at district level (found 5 unique locations)
Skipping indicator 'Median age at first sexual intercourse [Men]: 50-54' for year 2019 - not at district level (found 5 unique locations)
Skipping indicator 'Men circumcised' for year 2005 - not at district level (found 5 unique locations)
Skipping indicator 'Men circumcised' for year 2008 - not at district level (found 5 unique locations)
Skipping indicator 'Men circumcised' for year 2010 - not at district level (found 5 unique locations)
Skipping indicator 'Men circumcised' for year 2015 - not at district level (found 5 unique locations)
Skipping indicator 'Men circumcised' for year 2019 - not at district level (found 5 unique locations)
Skipping indicator 'Men who want no more children' for year 2005 - not at district level (found 5 unique locations)
Skipping indicator 'Men who want no more children' for year 2010 - not at district level (found 5 unique locations)
Skipping indicator 'Men who want no more children' for year 2015 - not at district level (found 5 unique locations)
Skipping indicator 'Men who want no more children' for year 2019 - not at district level (found 5 unique locations)
Skipping indicator 'Number of wives: One wife' for year 2005 - not at district level (found 5 unique locations)
Skipping indicator 'Number of wives: One wife' for year 2008 - not at district level (found 5 unique locations)
Skipping indicator 'Number of wives: One wife' for year 2010 - not at district level (found 5 unique locations)
Skipping indicator 'Number of wives: One wife' for year 2015 - not at district level (found 5 unique locations)
Skipping indicator 'Number of wives: One wife' for year 2019 - not at district level (found 5 unique locations)
Skipping indicator 'Number of wives: Two or more wives' for year 2005 - not at district level (found 5 unique locations)
Skipping indicator 'Number of wives: Two or more wives' for year 2008 - not at district level (found 5 unique locations)
Skipping indicator 'Number of wives: Two or more wives' for year 2010 - not at district level (found 5 unique locations)
Skipping indicator 'Number of wives: Two or more wives' for year 2015 - not at district level (found 5 unique locations)
Skipping indicator 'Number of wives: Two or more wives' for year 2019 - not at district level (found 5 unique locations)
Skipping indicator 'Recent sexual activity [Men]: Active 4 Weeks' for year 2005 - not at district level (found 5 unique locations)
Skipping indicator 'Recent sexual activity [Men]: Active 4 Weeks' for year 2010 - not at district level (found 5 unique locations)
Skipping indicator 'Recent sexual activity [Men]: Active 4 Weeks' for year 2015 - not at district level (found 5 unique locations)
Skipping indicator 'Recent sexual activity [Men]: Active 4 Weeks' for year 2019 - not at district level (found 5 unique locations)
Skipping indicator 'Recent sexual activity [Men]: Never had sex' for year 2005 - not at district level (found 5 unique locations)
Skipping indicator 'Recent sexual activity [Men]: Never had sex' for year 2010 - not at district level (found 5 unique locations)
Skipping indicator 'Recent sexual activity [Men]: Never had sex' for year 2015 - not at district level (found 5 unique locations)
Skipping indicator 'Recent sexual activity [Men]: Never had sex' for year 2019 - not at district level (found 5 unique locations)
Skipping indicator 'Recent sexual activity [Men]: One or more years ago' for year 2005 - not at district level (found 5 unique locations)
Skipping indicator 'Recent sexual activity [Men]: One or more years ago' for year 2010 - not at district level (found 5 unique locations)
Skipping indicator 'Recent sexual activity [Men]: One or more years ago' for year 2015 - not at district level (found 5 unique locations)
Skipping indicator 'Recent sexual activity [Men]: One or more years ago' for year 2019 - not at district level (found 5 unique locations)
Skipping indicator 'Recent sexual activity [Men]: Within the last year' for year 2005 - not at district level (found 5 unique locations)
Skipping indicator 'Recent sexual activity [Men]: Within the last year' for year 2010 - not at district level (found 5 unique locations)
Skipping indicator 'Recent sexual activity [Men]: Within the last year' for year 2015 - not at district level (found 5 unique locations)
Skipping indicator 'Recent sexual activity [Men]: Within the last year' for year 2019 - not at district level (found 5 unique locations)
Skipping indicator 'Children with ARI for whom advice or treatment was sought' for year 2005 - not at district level (found 5 unique locations)
Skipping indicator 'Children with ARI for whom advice or treatment was sought' for year 2008 - not at district level (found 5 unique locations)
Skipping indicator 'Children with ARI for whom advice or treatment was sought' for year 2010 - not at district level (found 5 unique locations)
Skipping indicator 'Children with ARI for whom advice or treatment was sought' for year 2015 - not at district level (found 5 unique locations)
Skipping indicator 'Children with ARI for whom advice or treatment was sought' for year 2019 - not at district level (found 2 unique locations)
Skipping indicator 'Children with symptoms of ARI' for year 2005 - not at district level (found 5 unique locations)
Skipping indicator 'Children with symptoms of ARI' for year 2008 - not at district level (found 5 unique locations)
Skipping indicator 'Children with symptoms of ARI' for year 2010 - not at district level (found 5 unique locations)
Skipping indicator 'Children with symptoms of ARI' for year 2015 - not at district level (found 5 unique locations)
Skipping indicator 'Children with symptoms of ARI' for year 2019 - not at district level (found 5 unique locations)
Skipping indicator 'Children with symptoms of ARI who received antibiotics' for year 2008 - not at district level (found 5 unique locations)
Skipping indicator 'Children with symptoms of ARI who received antibiotics' for year 2010 - not at district level (found 5 unique locations)
Skipping indicator 'Children with symptoms of ARI who received antibiotics' for year 2015 - not at district level (found 5 unique locations)
Skipping indicator 'Children with symptoms of ARI who received antibiotics' for year 2019 - not at district level (found 2 unique locations)
Skipping indicator 'Number of children born in the last five (or three) years' for year 2005 - not at district level (found 5 unique locations)
Skipping indicator 'Number of children born in the last five (or three) years' for year 2008 - not at district level (found 5 unique locations)
Skipping indicator 'Number of children born in the last five (or three) years' for year 2010 - not at district level (found 5 unique locations)
Skipping indicator 'Number of children born in the last five (or three) years' for year 2015 - not at district level (found 5 unique locations)
Skipping indicator 'Number of children born in the last five (or three) years' for year 2019 - not at district level (found 5 unique locations)
Skipping indicator 'Number of children born in the last five (or three) years (unweighted)' for year 2005 - not at district level (found 5 unique locations)
Skipping indicator 'Number of children born in the last five (or three) years (unweighted)' for year 2008 - not at district level (found 5 unique locations)
Skipping indicator 'Number of children born in the last five (or three) years (unweighted)' for year 2010 - not at district level (found 5 unique locations)
Skipping indicator 'Number of children born in the last five (or three) years (unweighted)' for year 2015 - not at district level (found 5 unique locations)
Skipping indicator 'Number of children born in the last five (or three) years (unweighted)' for year 2019 - not at district level (found 5 unique locations)
Skipping indicator 'Number of children with symptoms of ARI born in the last five (or three) years' for year 2005 - not at district level (found 5 unique locations)
Skipping indicator 'Number of children with symptoms of ARI born in the last five (or three) years' for year 2008 - not at district level (found 5 unique locations)
Skipping indicator 'Number of children with symptoms of ARI born in the last five (or three) years' for year 2010 - not at district level (found 5 unique locations)
Skipping indicator 'Number of children with symptoms of ARI born in the last five (or three) years' for year 2015 - not at district level (found 5 unique locations)
Skipping indicator 'Number of children with symptoms of ARI born in the last five (or three) years' for year 2019 - not at district level (found 2 unique locations)
Skipping indicator 'Number of children with symptoms of ARI born in the last five (or three) years (unweighted)' for year 2005 - not at district level (found 5 unique locations)
Skipping indicator 'Number of children with symptoms of ARI born in the last five (or three) years (unweighted)' for year 2008 - not at district level (found 5 unique locations)
Skipping indicator 'Number of children with symptoms of ARI born in the last five (or three) years (unweighted)' for year 2010 - not at district level (found 5 unique locations)
Skipping indicator 'Number of children with symptoms of ARI born in the last five (or three) years (unweighted)' for year 2015 - not at district level (found 5 unique locations)
Skipping indicator 'Number of children with symptoms of ARI born in the last five (or three) years (unweighted)' for year 2019 - not at district level (found 5 unique locations)
Created dataset with 6178 rows across 299 indicator-year combinations
df_adm2.head()
| indicator_name | district | aggregated_value | indicator_year | survey_name | survey_year_label | aggregation_method | source_sheet | |
|---|---|---|---|---|---|---|---|---|
| 0 | Antenatal care from a skilled provider | Butare | 89.600000 | 1992 | RW1992DHS | 1992 | mean | dhs-mobile_subnational_rwa |
| 1 | Antenatal care from a skilled provider | Butare/Gitarama | 93.600000 | 1992 | RW1992DHS | 1992 | mean | dhs-mobile_subnational_rwa |
| 2 | Antenatal care from a skilled provider | Byumba | 94.500000 | 1992 | RW1992DHS | 1992 | mean | dhs-mobile_subnational_rwa |
| 3 | Antenatal care from a skilled provider | Byumba/Kibungo | 94.266667 | 1992 | RW1992DHS | 1992 | mean | dhs-mobile_subnational_rwa |
| 4 | Antenatal care from a skilled provider | Cyangugu | 90.933333 | 1992 | RW1992DHS | 1992 | mean | dhs-mobile_subnational_rwa |
📝 Marking Notes for Part-1-Task-2
- Total Points: 25
- You can decide how to assign points
- Someone gets full points if they have code and they have displayed the dataframe above in their notebook
- Results at district level or sector level is okay, otherwise, national level is not accepatab
- Total Points-Part-1: 40
Introduction to Nightlights Dataset#
What is Nightlight Data?#
Nightlight data is satellite imagery capturing artificial light emissions from Earth’s surface during nighttime. Satellites like VIIRS collect this data regularly, providing an objective, real-time measure of human economic activity and development.
Raw Data: Radiance Measurements#
The fundamental measurement in nightlight data is radiance - the amount of light energy detected by satellite sensors, measured in nanowatts per square centimeter per steradian (nW/cm²/sr). Each pixel in satellite imagery contains a radiance value representing the light intensity from that specific location on Earth’s surface.
Annual Composite Generation#
This dataset was created from annual composite images using VIIRS nightlight files for Rwanda. Annual composites are generated by:
Aggregating daily/monthly observations throughout each year (2015, 2020, 2024)
Filtering out temporary light sources (fires, lightning, aurora)
Removing cloud-affected observations to ensure clear measurements
Averaging or taking median values to create stable, representative annual measurements
Masking techniques to exclude areas with unreliable data
The files used include both average composites (average_masked) and median composites (median_masked), with cloud-free versions (vcmslcfg) preferred over cloud-inclusive versions (vcmcfg) for more accurate measurements.
Why Use Nightlight Data?#
Consistent global coverage - Available everywhere, regardless of local data quality
Real-time updates - More current than traditional economic statistics
Objective measurement - Not subject to reporting biases
High resolution - Captures local development patterns
Proxy for development - Light intensity correlates with economic activity, infrastructure, and quality of life
Dataset Overview#
6,507 observations across Rwanda’s administrative cells
Three time periods: 2015, 2020, 2024
Cell-level data - Rwanda’s smallest administrative units
Allows temporal analysis of development trends
Variable Definitions#
Administrative Identifiers#
cell_id- Unique identifier for linking with other datasetsprovince_name- Province (5 total in Rwanda)district_name- District (30 total in Rwanda)sector_name- Administrative level between district and cellcell_name- Specific cell name
Core Nightlight Measurements#
total_nightlight#
Sum of all radiance values within cell boundaries
Key indicator of overall economic activity/development
Higher values = more total development
mean_nightlight#
Average radiance per pixel
Indicates development intensity regardless of cell size
Useful for comparing cells of different areas
median_nightlight#
Middle radiance value of all pixels (less sensitive to outliers)
Better represents typical lighting in unevenly developed areas
max_nightlight#
Highest radiance within cell
Indicates major infrastructure (hospitals, commercial centers)
min_nightlight & std_nightlight#
Minimum radiance and standard deviation
High std = uneven development within cell
Spatial Coverage Indicators#
pixel_count#
Total pixels in cell (indicates geographic size)
Used to normalize other measurements
lit_pixel_count#
Number of pixels with detectable light (radiance > 0)
Shows spatial extent of development
lit_pixel_percentage#
Percentage of cell area with lighting
Formula:
(lit_pixel_count ÷ pixel_count) × 1000% = completely dark, 100% = fully developed
year#
Time period: 2015, 2020, or 2024
Part-2: Demographic and Nightlights Data [60 Points]#
Part A: Varible Generation and Data Integration#
Population Dataset Variables (rwa-cell-pop.csv):#
Create the following derived variables:
dependency_ratio-(children_under_five_2020 + elderly_60_plus_2020) / working_age_population * 100people_per_building-general_2020 / building_countworking_age_population-general_2020 - children_under_five_2020 - elderly_60_plus_2020infrastructure_index- Your own formula that incorporatespeople_per_buildingand other relevant variables to measure infrastructure adequacy. Document and justify yourinfrastructure_indexmethodology, explaining howpeople_per_buildingand other variables contribute to measuring infrastructure pressure.
Nightlight Dataset Variables (cell-ntl-2015-2020-2024.csv):#
Create the following temporal and development indicators:
nightlight_change_2015_2024- Percentage change in total nightlight from 2015 to 2024mean_nightlight_change_2015_2024- Percentage change in mean nightlight from 2015 to 2024lit_pixel_percentage- Use existing or calculate:(lit_pixel_count / pixel_count) * 100
Data Integration:#
Merge the datasets using the appropriate column.
Part B: Exploratory Data Analysis#
Correlation Analysis:#
Correlation Heatmap: Create a heatmap showing correlations between 10 key variables (mix of demographic, infrastructure, and nightlight variables).
Report the top 3 variable pairs with the highest correlations and interpret their relationships.
Identify unexpected correlations and discuss potential explanations.
Nightlight Trend Analysis:#
District Ranking: Report the top 5 districts with the highest nightlight growth (2015-2024) and bottom 5 districts with the most decline or lowest growth.
Lit Pixel Analysis: Compare these districts using
lit_pixel_percentagechanges to understand whether growth represents intensification or spatial expansion.Create visualizations showing nightlight trends for these extreme districts.
Part C: Modeling#
Multivariate Linear Regression:#
Model Development: Build a multivariate linear regression model predicting population density using both demographic and nightlight variables as predictors. Explore as many variables as possible at the beginning.
Variable Selection: Test different combinations of variables and report the top 3 most predictive variables of population density.
Model Evaluation: Report R-squared, coefficients, and statistical significance. Interpret what these results tell us about population-infrastructure relationships.
Notes and Other Requirements#
Please follow the genral guidelines below when preparing your analysis..
Statistical Analysis:#
Properly handle missing data and outliers
Use appropriate statistical tests and report p-values
Calculate and interpret correlation coefficients
Validate regression assumptions (normality, homoscedasticity)
Data Management:#
Document all data cleaning and aggregation steps using markdown
Ensure consistent district naming across datasets
Visualization Standards:#
Create clear, publication-quality heatmaps with appropriate color scales
Design effective time series plots for nightlight trends
Include proper axis labels, titles, and legends
Use consistent formatting across all visualizations
Reporting Requirements:#
Clearly state the top 3 most predictive variables with statistical justification
Provide ranked lists for nightlight growth districts with supporting metrics
Include model performance statistics and interpretation
Document all methodological choices and assumptions
Create Population Dataset Variables#
df_pop = pd.read_csv(FILE_CELL_POP_RW)
df_ntl = pd.read_csv(FILE_CELL_NTL_RW)
# ==================================================================
# GENERATE ADDITIONAL VARIABLES IN POPULAITON DATAFRAME
# ==================================================================

# Create derived variables for population dataset
df_pop['working_age_population'] = (df_pop['general_2020'] -
                                   df_pop['children_under_five_2020'] -
                                   df_pop['elderly_60_plus_2020'])


# Calculate dependency ratio
df_pop['dependency_ratio'] = ((df_pop['children_under_five_2020'] + df_pop['elderly_60_plus_2020']) /
                             df_pop['working_age_population'] * 100)

# Handle infinity values in dependency ratio
# We fill with median but these cn be left as NaN
df_pop['dependency_ratio'] = df_pop['dependency_ratio'].replace([np.inf, -np.inf], np.nan)
df_pop['dependency_ratio'].fillna(df_pop['dependency_ratio'].median(), inplace=True)

# Calculate people per building
# We fill NaN with median but these cn be left as NaN
df_pop['people_per_building'] = df_pop['general_2020'] / df_pop['building_count']
df_pop['people_per_building'] = df_pop['people_per_building'].replace([np.inf, -np.inf], np.nan)
df_pop['people_per_building'].fillna(df_pop['people_per_building'].median(), inplace=True)

# Create population density (people per unit area proxy)
df_pop['total_population'] = df_pop['general_2020']  # Using total population as proxy

# Create Infrastructure Index
/var/folders/4k/7vm8r4rj2g90lf39dt0pqwbr0000gn/T/ipykernel_44216/3386350694.py:18: FutureWarning: A value is trying to be set on a copy of a DataFrame or Series through chained assignment using an inplace method.
The behavior will change in pandas 3.0. This inplace method will never work because the intermediate object on which we are setting values always behaves as a copy.

For example, when doing 'df[col].method(value, inplace=True)', try using 'df.method({col: value}, inplace=True)' or df[col] = df[col].method(value) instead, to perform the operation inplace on the original object.


  df_pop['dependency_ratio'].fillna(df_pop['dependency_ratio'].median(), inplace=True)
/var/folders/4k/7vm8r4rj2g90lf39dt0pqwbr0000gn/T/ipykernel_44216/3386350694.py:24: FutureWarning: A value is trying to be set on a copy of a DataFrame or Series through chained assignment using an inplace method.
The behavior will change in pandas 3.0. This inplace method will never work because the intermediate object on which we are setting values always behaves as a copy.

For example, when doing 'df[col].method(value, inplace=True)', try using 'df.method({col: value}, inplace=True)' or df[col] = df[col].method(value) instead, to perform the operation inplace on the original object.


  df_pop['people_per_building'].fillna(df_pop['people_per_building'].median(), inplace=True)
# Create Infrastructure Index based only on people_per_building

# Calculate z-scores for people_per_building (how many standard deviations from mean)
df_pop['people_per_building_zscore'] = (df_pop['people_per_building'] - df_pop['people_per_building'].mean()) / df_pop['people_per_building'].std()

# Infrastructure index - invert and scale to 0-100 range
# Lower people_per_building means better infrastructure (less crowding)
# We invert the z-score and scale to 0-100 range where higher = better infrastructure

# Find min and max z-scores for scaling
min_z = df_pop['people_per_building_zscore'].min()
max_z = df_pop['people_per_building_zscore'].max()

# Create the infrastructure index (scaled 0-100)
# Subtract from max_z to invert (lower people_per_building = higher infrastructure index)
df_pop['infrastructure_index'] = 100 * (max_z - df_pop['people_per_building_zscore']) / (max_z - min_z)

# Round to 2 decimal places
df_pop['infrastructure_index'] = df_pop['infrastructure_index'].round(2)
Create Nightlight Dataset Variables#
# ==================================================================
# GENERATE ADDITIONAL NTL VARIABLES
# ==================================================================

# Pivot nightlight data to get values by year
df_ntl_pivot = df_ntl.pivot_table(
    index=['cell_id', 'province_name', 'district_name', 'sector_name', 'cell_name'],
    columns='year',
    values=['total_nightlight', 'mean_nightlight', 'lit_pixel_count', 'pixel_count'],
    aggfunc='first'
).reset_index()

# Flatten column names
df_ntl_pivot.columns = ['_'.join([str(col[0]), str(col[1])]) if col[1] != ''
                    else str(col[0]) for col in df_ntl_pivot.columns]

# Clean column names
df_ntl_pivot.columns = [col.replace('_', '') if col.endswith('_') else col for col in df_ntl_pivot.columns]

# Calculate nightlight changes (2015-2024)
# Replace division by zero with NaN instead of adding a small value
df_ntl_pivot['nightlight_change_2015_2024'] = np.where(
    df_ntl_pivot['total_nightlight_2015'] == 0,
    np.nan,
    (df_ntl_pivot['total_nightlight_2024'] - df_ntl_pivot['total_nightlight_2015']) /
    df_ntl_pivot['total_nightlight_2015'] * 100
)

df_ntl_pivot['mean_nightlight_change_2015_2024'] = np.where(
    df_ntl_pivot['mean_nightlight_2015'] == 0,
    np.nan,
    (df_ntl_pivot['mean_nightlight_2024'] - df_ntl_pivot['mean_nightlight_2015']) /
    df_ntl_pivot['mean_nightlight_2015'] * 100
)

# Calculate lit pixel percentage for each year
for year in [2015, 2020, 2024]:
    df_ntl_pivot[f'lit_pixel_percentage_{year}'] = (
        df_ntl_pivot[f'lit_pixel_count_{year}'] / df_ntl_pivot[f'pixel_count_{year}'] * 100
    )

df_ntl_pivot['lit_pixel_change_2015_2024'] = (
    df_ntl_pivot['lit_pixel_percentage_2024'] - df_ntl_pivot['lit_pixel_percentage_2015']
)

print("Nightlight variables created successfully!")
print(f"Nightlight change range: {df_ntl_pivot['nightlight_change_2015_2024'].min():.2f}% - {df_ntl_pivot['nightlight_change_2015_2024'].max():.2f}%")
Nightlight variables created successfully!
Nightlight change range: -65.31% - 3157.42%
📝 Marking Notes for Part-2-Variable Generation
- Total Points: 10
- You can decide how to assign points
Data Integration#
df_ntl_pivot.drop(columns=['province_name', 'district_name', 'sector_name', 'cell_name'], inplace=True)

df = pd.merge(df_pop, df_ntl_pivot, on="cell_id", how="left")
📝 Marking Notes for Part-2-Data Integration
- Total Points: 5
- You can decide how to assign points
Exploratory Analysis#
# Select key variables for correlation analysis
key_vars = [
    'dependency_ratio', 'people_per_building', 'infrastructure_index',
    'total_population', 'nightlight_change_2015_2024', "building_count",
    'mean_nightlight_change_2015_2024', 'lit_pixel_change_2015_2024',
    'total_nightlight_2024', 'mean_nightlight_2024', 'lit_pixel_percentage_2024'
]

# Create correlation matrix
corr_matrix = df[key_vars].corr()

# Create correlation heatmap
plt.figure(figsize=(10, 8))
sns.heatmap(corr_matrix, annot=True, cmap='RdBu_r', center=0,
            square=True, linewidths=0.5, cbar_kws={"shrink": .8})
plt.title('Correlation Heatmap: Key Variables', fontsize=16, pad=20)
plt.tight_layout()
plt.show()
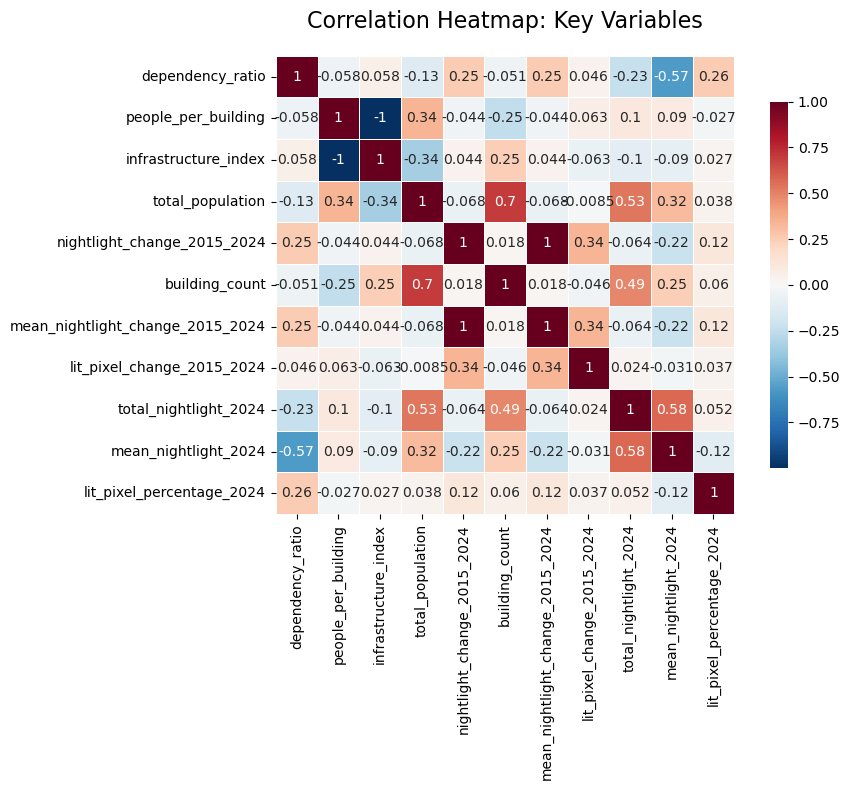
Based on Manual Inspection, Below is a List of Top and Intresting Correlations#
'total_population' and 'building_count': 0.7
'dependency_ratio' and 'mean_nightlight_change_2024': -0.57
'total_population' and 'ltotal_night_light_2024': 0.53
Trends in Night Lights#
df_ntl_dist = df.groupby('district_name').agg({
    'nightlight_change_2015_2024': 'mean',
    'lit_pixel_change_2015_2024': 'mean',
    'total_nightlight_2015': 'mean',
    'total_nightlight_2024': 'mean',
    'lit_pixel_percentage_2015': 'mean',
    'lit_pixel_percentage_2024': 'mean'
}).reset_index()
# Top 5 districts with highest nightlight growth
top_5_growth = df_ntl_dist.nlargest(5, 'nightlight_change_2015_2024')
bottom_5_growth = df_ntl_dist.nsmallest(5, 'nightlight_change_2015_2024')

print("TOP 5 DISTRICTS - HIGHEST NIGHTLIGHT GROWTH (2015-2024):")
print("="*60)
for idx, row in top_5_growth.iterrows():
    print(f"{row['district_name']}: {row['nightlight_change_2015_2024']:.1f}% growth")

print("\nBOTTOM 5 DISTRICTS - LOWEST NIGHTLIGHT GROWTH (2015-2024):")
print("="*60)
for idx, row in bottom_5_growth.iterrows():
    print(f"{row['district_name']}: {row['nightlight_change_2015_2024']:.1f}% growth")

# Visualization of extreme districts
fig, (ax1, ax2) = plt.subplots(1, 2, figsize=(16, 6))

# Top 5 districts
top_5_growth.plot(x='district_name', y='nightlight_change_2015_2024',
                 kind='bar', ax=ax1, color='green', alpha=0.7)
ax1.set_title('Top 5 Districts: Nightlight Growth', fontsize=14)
ax1.set_ylabel('Nightlight Change (%)')
ax1.tick_params(axis='x', rotation=45)

# Bottom 5 districts
bottom_5_growth.plot(x='district_name', y='nightlight_change_2015_2024',
                    kind='bar', ax=ax2, color='red', alpha=0.7)
ax2.set_title('Bottom 5 Districts: Nightlight Growth', fontsize=14)
ax2.set_ylabel('Nightlight Change (%)')
ax2.tick_params(axis='x', rotation=45)

plt.tight_layout()
plt.show()
TOP 5 DISTRICTS - HIGHEST NIGHTLIGHT GROWTH (2015-2024):
============================================================
Nyaruguru: 877.4% growth
Nyagatare: 757.5% growth
Bugesera: 716.3% growth
Kirehe: 639.0% growth
Ngoma: 623.5% growth

BOTTOM 5 DISTRICTS - LOWEST NIGHTLIGHT GROWTH (2015-2024):
============================================================
Nyarugenge: 192.7% growth
Rubavu: 318.4% growth
Kicukiro: 387.8% growth
Muhanga: 390.8% growth
Nyanza: 399.0% growth
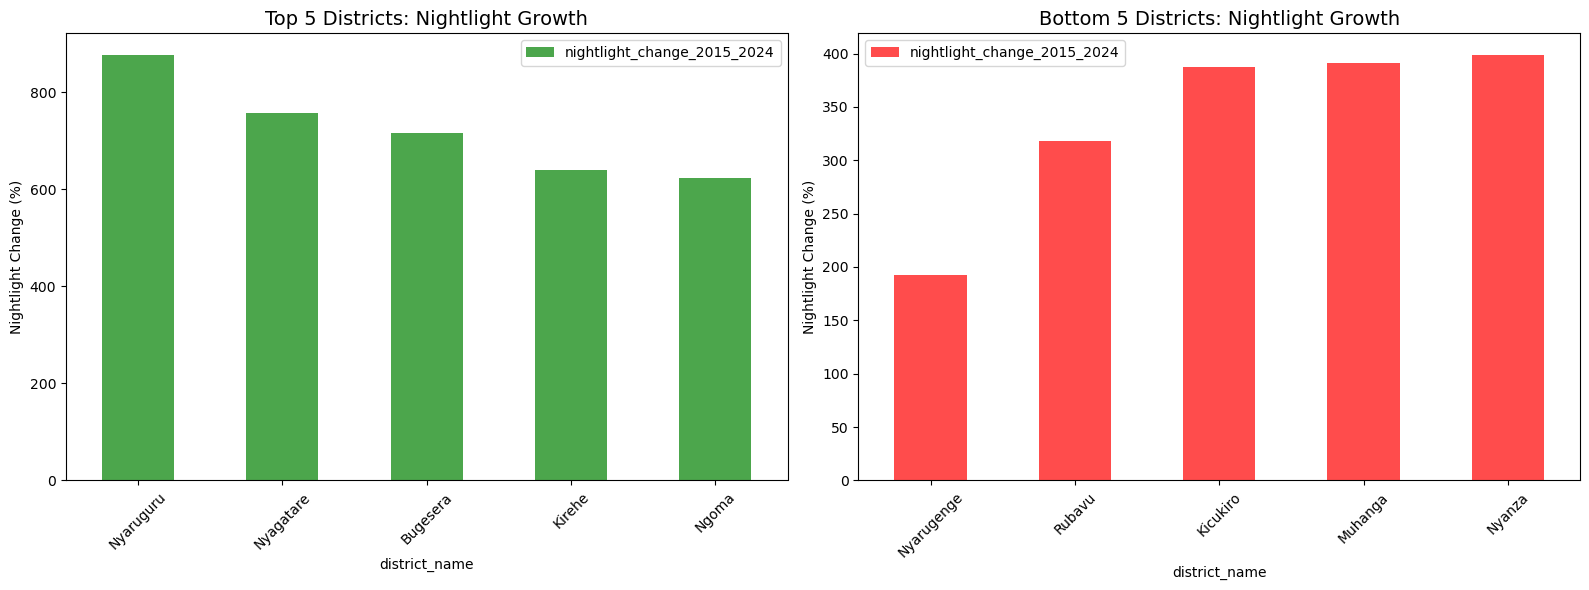
📝 Marking Notes for Part-2-EDA
- Heatmap: 10
- Interesting Correlations: 5
- NTL Trends: 10
Modelling#
# Prepare variables for modeling
predictor_vars = ['nightlight_change_2015_2024', 'mean_nightlight_change_2015_2024', 'building_count',
    'total_nightlight_2024', 'mean_nightlight_2024', 'lit_pixel_percentage_2024','mean_nightlight_2020',
    'lit_pixel_percentage_2020', 'lit_pixel_change_2015_2024'
]

target_var = 'total_population'
# Filter out rows with NaN values
df_model = df.dropna(subset=predictor_vars + [target_var])

# Add constant term for intercept
X = sm.add_constant(df_model[predictor_vars])
y = df_model[target_var]

# Fit the model
model = sm.OLS(y, X).fit()

# Print model summary
print(model.summary())

# Find the top 3 most predictive variables
# We'll use absolute t-statistic values to rank variable importance
var_importance = pd.DataFrame({
    'Variable': predictor_vars,
    'Coefficient': model.params[1:],  # Skip the constant term
    'P-value': model.pvalues[1:],     # Skip the constant term
    'Abs_t_stat': abs(model.tvalues[1:])  # Skip the constant term
}).sort_values('Abs_t_stat', ascending=False)

# Display the top 3 most predictive variables
top_3_vars = var_importance.head(3)
print("\nTop 3 most predictive variables:")
print(top_3_vars)

# Create a simpler model with just the top 3 variables
X_top3 = sm.add_constant(df_model[top_3_vars['Variable'].tolist()])
model_top3 = sm.OLS(y, X_top3).fit()

# Print the simpler model summary
print("\nModel with top 3 variables:")
print(model_top3.summary())

# Create a scatter plot of actual vs predicted values
plt.figure(figsize=(10, 6))
plt.scatter(y, model_top3.predict(), alpha=0.5)
plt.plot([y.min(), y.max()], [y.min(), y.max()], 'r--')
plt.xlabel('Actual Population')
plt.ylabel('Predicted Population')
plt.title('Actual vs Predicted Population Using Top 3 Variables')
plt.grid(True, alpha=0.3)
plt.tight_layout()
plt.show()
                            OLS Regression Results
==============================================================================
Dep. Variable:       total_population   R-squared:                       0.540
Model:                            OLS   Adj. R-squared:                  0.538
Method:                 Least Squares   F-statistic:                     281.3
Date:                Fri, 19 Sep 2025   Prob (F-statistic):               0.00
Time:                        13:00:30   Log-Likelihood:                -20322.
No. Observations:                2163   AIC:                         4.066e+04
Df Residuals:                    2153   BIC:                         4.072e+04
Df Model:                           9
Covariance Type:            nonrobust
====================================================================================================
                                       coef    std err          t      P>|t|      [0.025      0.975]
----------------------------------------------------------------------------------------------------
const                             2213.2951    341.388      6.483      0.000    1543.810    2882.780
nightlight_change_2015_2024       4.224e+05   2.67e+06      0.158      0.874   -4.81e+06    5.65e+06
mean_nightlight_change_2015_2024 -4.224e+05   2.67e+06     -0.158      0.874   -5.65e+06    4.81e+06
building_count                       2.9272      0.087     33.623      0.000       2.757       3.098
total_nightlight_2024               13.7070      1.244     11.022      0.000      11.268      16.146
mean_nightlight_2024               219.5286    214.385      1.024      0.306    -200.894     639.951
lit_pixel_percentage_2024        -1068.1185    790.110     -1.352      0.177   -2617.577     481.341
mean_nightlight_2020              -214.2300    365.571     -0.586      0.558    -931.139     502.679
lit_pixel_percentage_2020         1068.5510    789.789      1.353      0.176    -480.277    2617.379
lit_pixel_change_2015_2024         500.7809    188.848      2.652      0.008     130.437     871.125
==============================================================================
Omnibus:                     1939.170   Durbin-Watson:                   1.110
Prob(Omnibus):                  0.000   Jarque-Bera (JB):           221683.446
Skew:                           3.728   Prob(JB):                         0.00
Kurtosis:                      52.032   Cond. No.                     9.91e+07
==============================================================================

Notes:
[1] Standard Errors assume that the covariance matrix of the errors is correctly specified.
[2] The condition number is large, 9.91e+07. This might indicate that there are
strong multicollinearity or other numerical problems.

Top 3 most predictive variables:
                                              Variable  Coefficient  \
building_count                          building_count     2.927238
total_nightlight_2024            total_nightlight_2024    13.706998
lit_pixel_change_2015_2024  lit_pixel_change_2015_2024   500.780863

                                  P-value  Abs_t_stat
building_count              1.425043e-199   33.622678
total_nightlight_2024        1.601139e-27   11.022217
lit_pixel_change_2015_2024   8.066012e-03    2.651763

Model with top 3 variables:
                            OLS Regression Results
==============================================================================
Dep. Variable:       total_population   R-squared:                       0.534
Model:                            OLS   Adj. R-squared:                  0.534
Method:                 Least Squares   F-statistic:                     825.2
Date:                Fri, 19 Sep 2025   Prob (F-statistic):               0.00
Time:                        13:00:30   Log-Likelihood:                -20337.
No. Observations:                2163   AIC:                         4.068e+04
Df Residuals:                    2159   BIC:                         4.070e+04
Df Model:                           3
Covariance Type:            nonrobust
==============================================================================================
                                 coef    std err          t      P>|t|      [0.025      0.975]
----------------------------------------------------------------------------------------------
const                       1698.7816    113.001     15.033      0.000    1477.179    1920.384
building_count                 2.8945      0.085     33.978      0.000       2.727       3.062
total_nightlight_2024         15.5039      1.043     14.869      0.000      13.459      17.549
lit_pixel_change_2015_2024   143.4122    174.158      0.823      0.410    -198.123     484.947
==============================================================================
Omnibus:                     1939.588   Durbin-Watson:                   1.109
Prob(Omnibus):                  0.000   Jarque-Bera (JB):           232689.703
Skew:                           3.712   Prob(JB):                         0.00
Kurtosis:                      53.267   Cond. No.                     4.20e+03
==============================================================================

Notes:
[1] Standard Errors assume that the covariance matrix of the errors is correctly specified.
[2] The condition number is large, 4.2e+03. This might indicate that there are
strong multicollinearity or other numerical problems.
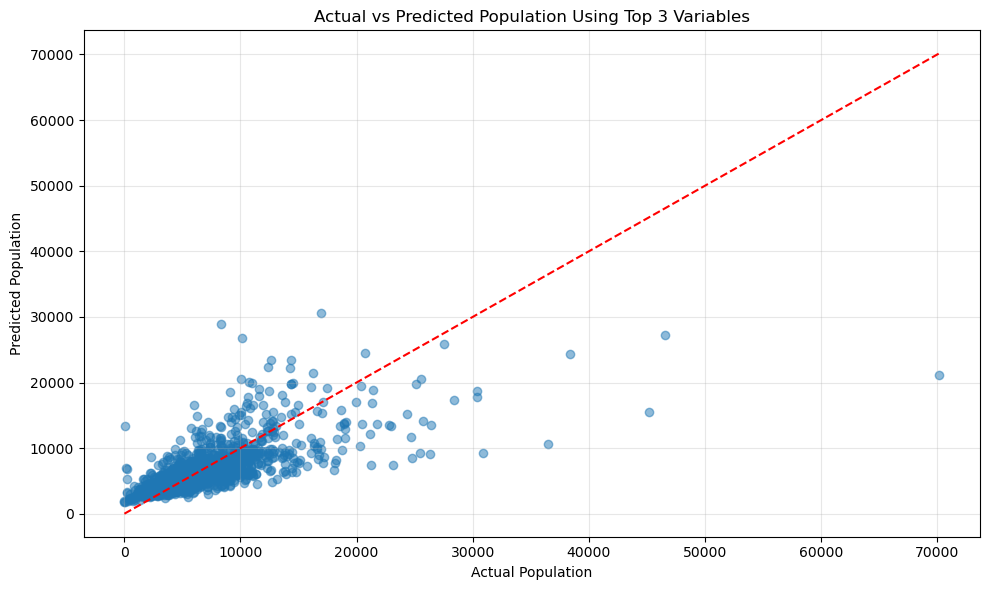
top_3_vars
| Variable | Coefficient | P-value | Abs_t_stat | |
|---|---|---|---|---|
| building_count | building_count | 2.927238 | 1.425043e-199 | 33.622678 |
| total_nightlight_2024 | total_nightlight_2024 | 13.706998 | 1.601139e-27 | 11.022217 |
| lit_pixel_change_2015_2024 | lit_pixel_change_2015_2024 | 500.780863 | 8.066012e-03 | 2.651763 |
📝 Marking Notes for Part-2-Modelling
- Variable Selection: 10
- Model definition and fittting: 15
- Top variable selection and scatter scatterplot: 15